Annex 1. Report methodology
Background
The first report on the status of road safety in the Region of the Americas1 was published in 2009. This is the fifth report in the series, which aligns with the framework of the Decade of Action for Road Safety 2021-2030. Like previous reports, this fifth report was written through an iterative consultation process with Member States and territories of the Region.
A regional network of regional advisors and regional data focal points was established. These individuals then participated in the data collection process. Data were collected in 2022 and 2023. An updated, standardized online survey managed by the Pan American Health Organization was used, and the process was aided by government-appointed national data focal points (NDFPs). NDFPs worked alongside up to 10 national data contributors (NDCs). Their subject expertise helped complete and develop the survey.
Haiti is participating in the regional report for the first time. Twenty-six countries have participated in all five editions since its first publication. Thirty-one Member States and one territory participated in this fifth regional report.2
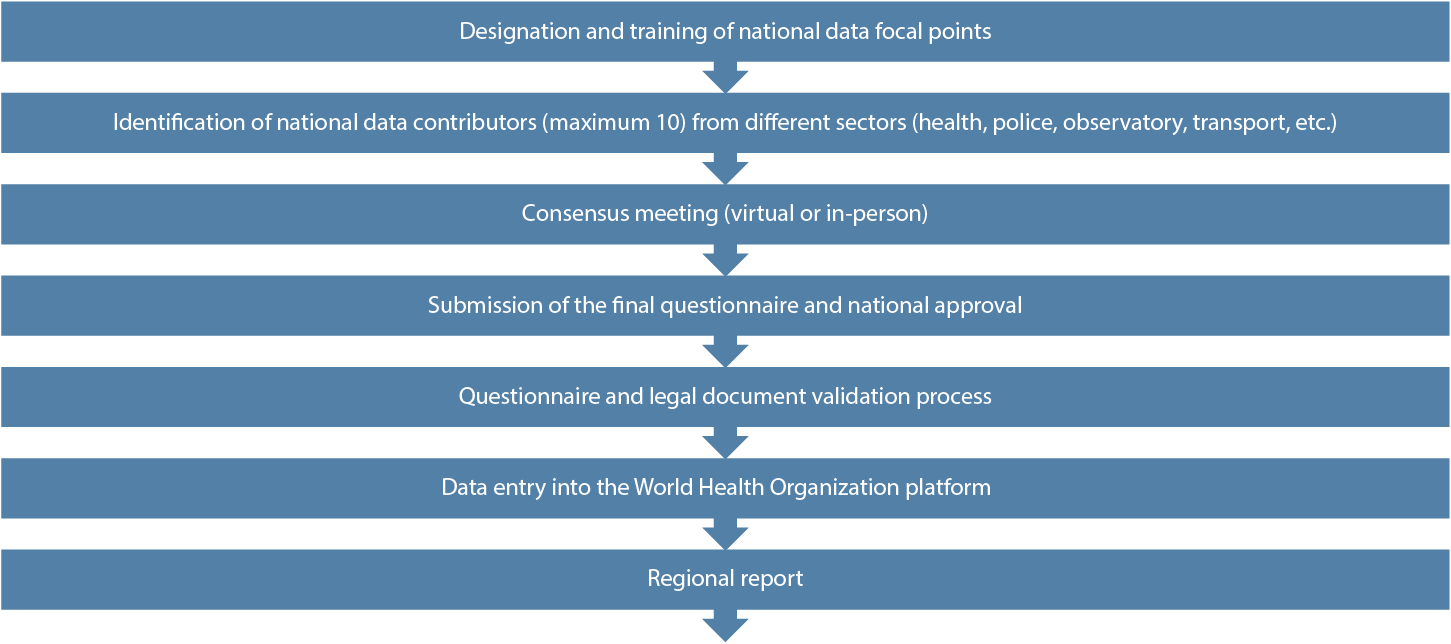
NDFPs were trained on the reporting methodology (Figure A1.1) and using the platform via online meetings. The data collection process was subject to extensive feedback, consultation, and verification processes, involving NDFPs. Data and supporting documents were verified as part of the validation process, and discrepancies were forwarded to NDFPs for resolution. Finally, validated data were entered into an online database created especially for this report.
Figure A1.1. Reporting methodology
Regional data analysis
The analysis on the extent of the problem of road traffic crashes and deaths does not include data from countries or territories that did not participate in the report (Grenada, Puerto Rico, Saint Kitts and Nevis, Saint Vincent and the Grenadines, and Venezuela [Bolivarian Republic of]). However, data from Venezuela (Bolivarian Republic of) were included in the total number of deaths and mortality rate for the Region of the Americas. Mortality data from the British Virgin Islands were excluded. When analyzing the total number of deaths and subregional data, Puerto Rico was considered part of the Latin Caribbean. However, its data were not included in the income level analysis and respective figure. It is worth noting that the most recent data on Guyana’s road traffic mortality rate is from 2014, while the United States’ data is from 2020. The World Bank did not classify Venezuela (Bolivarian Republic of) by income level from 2020 to 2022. The data used for vehicle registration analysis do not include those from the Bahamas, Belize, and Haiti, since these countries did not provide this information.
Data used for the institutional road safety management section considered three variables. Information on these variables has been available from the first report to the fifth, which includes 32 countries. They include:
- Having a coordinating body responsible for road safety activities.
- A national road safety strategy.
- Funding for the coordinating body and its duties.
For the country-specific analysis, road safety management variables were extracted for the following dimensions:
- Coordinating body: location within the government structure, duties, funding sources.
- National road safety strategy: scope of application (national or subnational), and objectives and targets regarding deaths and risk factors in road safety.
- Availability of data systems: health information systems and mobility information systems.
The indicator for assessing compliance with global good practice in road safety management was built in accordance with the following technical sheet:
| Attribute | Description | ||||||||||||||||||||
|---|---|---|---|---|---|---|---|---|---|---|---|---|---|---|---|---|---|---|---|---|---|
| Indicator name | Global good practice in road safety management. | ||||||||||||||||||||
| Domain | Road safety. | ||||||||||||||||||||
| Subdomain | Injury prevention. | ||||||||||||||||||||
| Definition | Proportion of compliance with global good practice in road safety management in a given country, territory, or geographical area in relation to the total number of activities or the registration system in place in the participating country in the report on the status of road safety in the Region of the Americas. | ||||||||||||||||||||
| Unit of measurement | Percentage. | ||||||||||||||||||||
| Type of statistic | Predicted. | ||||||||||||||||||||
| Purpose | The indicator is useful for assessing national or regional compliance with global good practice in road safety management. Road safety management helps to reduce road traffic injuries by identifying at-risk population groups. These groups should be targeted with comprehensive prevention, health education, and promotion strategies. It also helps to drive improvements in registration systems, infrastructure, and research. It can also be useful for estimating the resources (human, material, financial) needed to universalize good practice based on the analysis of the most pressing road safety risks. | ||||||||||||||||||||
| Calculation method | Information used to estimate the percentage of compliance with global good practice comes from the World Health Organization (WHO) Global Status Report on Road Safety (GSRRS) 2023 country survey, and the WHO database of global reports from 2009 to 2018. Variables for this indicator correspond to the three dimensions of road safety management: coordinating body, national road safety strategy, and availability of data systems. At the regional level, three variables from two dimensions were used to determine the proportion of countries complying with global good practice in road safety management: “Having a national governing body to implement the national road safety action plan”, “Having national or subnational (i.e., state or provincial) road safety strategies”, and “Funding to implement the strategy”. At the national level, all variables from the three dimensions of road safety management were used to determine the proportion of compliance with global good practice by country, territory, or geographical area. Global good practice is found in WHO-published recommendations. A score was assigned for each practice or variable analyzed in the three dimensions, as follows:
Percentage of compliance with global good practice in road safety management at the regional level was calculated as follows: Score = 0: Percentage = 0%-59%. Score = 1: Percentage = 60%-79%. Score = 2: Percentage = 80%-100%. Percentage of compliance with global good practice at the national level was assessed as follows: Number of countries in the Region of the Americas whose analyzed practice complies with global good practice in a given period ___________________________________________________________________x 100 Total number of countries that participated in the report on the status of road safety in the Region of the Americas in the given period The data provided by each country in 2023 was then analyzed separately, with a maximum score of 112, using the percentage of compliance with global best practice as an indicator. The formula used was: Score obtained for compliance of the practices in a given period ___________________________________________________________________x 100 Total score of practices that comply with global best practice in a given period A traffic light system was used to more clearly show percentage of compliance with global good practice in road safety management:
|
||||||||||||||||||||
| Interpretation | According to data available in 2023, the percentage of compliance with global good practice in road safety management in country A is X%, which means that, in country A, X activities out of every 100 are carried out in accordance with global good practice. | ||||||||||||||||||||
| Breakdown | Regional and national. | ||||||||||||||||||||
| Limitations | The accuracy of this indicator depends on the quality and regularity of updated data from the road safety status report survey. Since the estimate only includes the countries in the Region of the Americas that participated in the survey, it does not represent all countries in the Region. Therefore, the value of this indicator may differ from the results obtained in each country. Discrepancies may also occur since the Pan American Health Organization-estimated indicator is based on information provided by experts and decision-makers in each country. | ||||||||||||||||||||
| Data source | World Health Organization. Global status report on road safety 2023. Annex 1. Geneva: WHO; 2023. World Health Organization database for global reports from 2009 to 2018: The Global Health Observatory. Road safety (for more information, visit: https://www.who.int/data/gho/data/themes/road-safety). WHO Road Safety Data App (for more information, visit: https://www.who.int/teams/social-determinants-of-health/safety-and-mobility/who-grsinfo-an-app-for-road-safety-data). |
||||||||||||||||||||
| Frequency | Variable. | ||||||||||||||||||||
| References |
World Health Organization. Global status report on road safety 2023. Geneva: WHO; 2023;. Pan American Health Organization. Good road safety practices in the Americas: action-oriented data and stories. Washington, D.C.: PAHO; 2019. Available from: https://iris.paho.org/handle/10665.2/51353. Pan American Health Organization. Status of Road Safety in the Region of the Americas. Washington, D.C.: PAHO; 2019. Pan American Health Organization. Report on Road Safety in the Region of the Americas. Washington, D.C.: PAHO; 2015. Available from: https://iris.paho.org/handle/10665.2/28560. Pan American Health Organization. Road Safety in the Americas [Internet]. Washington, D.C.: PAHO; 2016. Available from: https://iris.paho.org/handle/10665.2/28564. Pan American Health Organization. Report on Road Safety in the Region of the Americas. Washington, D.C.: PAHO; 2009. |
Global estimates of road traffic deaths
The regression model used covariates related to economic development, road transport factors, legislation, road use, safety governance, and access to the health system. The World Health Organization (WHO) developed mortality estimates using regression models and updated data from the Civil Registration and Vital Statistics for the period 2000-2021, with at least 80% completeness, following the criteria of the International Classification of Diseases, 10th revision (ICD-10). All health ministries submitted death registration data, mostly using ICD-10 coding.
For this fifth report, countries were classified according to their Civil Registration and Vital Statistics data:
- Group 1: countries with death registration data.
- Group 2: unlike previous reports, in this report, Group 2 was split into two subcategories (2A and 2B) based on the improvement of their data systems.
- Group 2A: countries that improved their data systems with WHO support, using the capture-recapture method for estimation.
- Group 2B: countries in the process of improving their data systems, with a low completeness (around 30%) of road traffic death registration data. These countries conduct data linkage with WHO support, focusing on specific geographic areas due to limited resources or a phased approach.
- Group 3: countries with a population of less than 150,000 inhabitants.
- Group 4: countries without eligible death registration data, managed with three separate negative binomial regression models.
Countries received these estimates as part of the validation and verification process. For more detailed information on WHO mortality estimate methodology, click here.
Legislative analysis
As part of the data collection process, legislation submitted by each country was reviewed and assessed. A section of the global survey was designed to address key aspects of the five major risk factors: speed, drink driving, use of seat belts, motorcycle helmets, and child restraint systems.
Participants were asked to provide copies of relevant laws for a comprehensive review. Good practice criteria were then used to classify legislation based on data completeness. These minimum criteria are widely recognized as having a significant impact on safety.
The legal review was conducted between January and September 2023. Legislation in force before 31 December 2022 was taken into account. It is worth noting that, due to their federal structure, the subnational laws of two countries in the Region (the United States and Canada) were reviewed. A national law in both these countries is deemed to exist only if 80% of their subnational entities meet selected good practice criteria.
As well as describing how legislation on the five risk factors has evolved based on data from the 2015 and 2018 road safety reports, the legal analysis also addresses issues that were not included in the global survey. This process aimed to obtain a more comprehensive understanding of the legal situation on road safety. New areas included rest periods for professional drivers, specific vehicle safety aspects, vehicle registration and inspection, third-party liability insurance, roads and infrastructure, access to emergency care, rehabilitation or psychological assistance for victims, and Good Samaritan laws.
In some cases, WHO searched for legal documents that could deepen the analysis beyond the five risk factors. All analysis was shared with NDFPs, who were given the opportunity to validate the information provided. If they disagreed with any of the findings, they were encouraged to send additional documents to support their responses.
Annex 2. Country profiles
For detailed information on each country and territory, see the National Road Safety Profile.
Annex 3. Status of global performance targets on road safety
For detailed information on each country and territory, see the Voluntary Targets Monitoring Tool.
Annex 4. Estimating the effect of approved safety systems on the burden of road traffic injuries in 10 countries in the Region of the Americas
Summary
Background
Road traffic injuries result in around 1.3 million annual deaths and 50 million injuries worldwide. Approximately 90% of these deaths and injuries occur in low- and middle-income countries (1). In the Region of the Americas alone, road traffic crashes result in more than 150,000 deaths each year, equivalent to a mortality rate of 15.6 per 100,000 inhabitants (2).
In 2015, the United Nations General Assembly adopted the 2030 Agenda for Sustainable Development (3). Goals| 3.6 and 11.2 aim to halve the number of global road traffic deaths and provide safe, affordable, accessible, and sustainable transport for all (3). Subsequently, in 2020, the Assembly adopted Resolution 74/299, which proclaimed the period from 2021 to 2030 as the Second Decade of Action for Road Safety 2021-2030 (4). This Resolution called on the World Health Organization (WHO) to prepare an action plan to guide and support the implementation of evidence-based recommendations on road safety, using a safe systems approach. The Global Plan for the Decade of Action for Road Safety 2021-2030 was presented in 2021 (1).
The Global Plan emphasizes that “vehicles should be designed to ensure the safety of those inside and those outside them”. Various safety devices can be incorporated into vehicle design to prevent collisions or reduce the severity of any injuries that occur. However, while many of these devices have been around for decades, market penetration largely depends on local regulations for new and used vehicles. In most low- and middle-income countries, these regulations are either non-existent or inadequate. The Global Plan therefore recommends that countries adopt minimum standards with safety best practices promoted by the United Nations Economic Commission for Europe (UNECE) World Forum for Harmonization of Vehicle Regulations (WP29) (5).
In 2022, the United Nations General Assembly held a high-level meeting on improving road safety worldwide. This meeting —one of the few to address a specific public health issue— offered countries and different regions the opportunity to mobilize policymakers and identify challenges and opportunities to promote multisectoral action and multi-stakeholder collaboration. Member States signed a political declaration in which they committed to developing and implementing regional, national, and subnational plans, as well as adopting evidence-based good practice to address key risk factors and strengthen international cooperation on road safety by exchanging good practice, effective enforcement mechanisms, and technical standards. The aim was to ensure that, by 2030, all vehicles manufactured and marketed in all markets have adequate safety performance (6).
As a result, the Pan American Health Organization (PAHO) —a specialized health agency of the Inter-American System, serving as the WHO Regional Office for the Americas— developed a strategy to accelerate the Global Plan’s implementation in priority countries in the Region of the Americas, with support from various areas of PAHO and WHO. Part of this strategy involved identifying a group of nine priority countries that would benefit from increased efforts to accelerate the implementation of the Global Plan’s key recommendations. The purpose of this study is to generate key evidence likely to inform policy decision-making processes in these countries, as part of the actions linked to this regional strategy.
Objective
With the aim of supporting and informing local road safety initiatives, this study’s objective was to estimate the potential effects of adopting key UN standards on vehicle safety devices, child restraint systems, and full-face motorcycle helmets on the burden of road traffic injuries in 10 countries in the Region of the Americas. This was done using information collected as part of the Fifth Global Status Report on Road Safety, coordinated by WHO as part of its mandate under various United Nations General Assembly resolutions. The 10 countries included in this study are Belize, Bolivia (Plurinational State of), Costa Rica, the Dominican Republic, El Salvador, Guatemala, Honduras, Jamaica, Nicaragua, and Paraguay.
Methodological approach
Counterfactual analysis was used in this study. This methodological approach evaluates the potential reduction in fatal and non-fatal injuries and years of healthy life lost due to road traffic crashes, if the analyzed countries were to use eight proven vehicle safety devices, child restraint systems, and motorcycle helmets, regulated by the UNECE, and adopted in their entirety by the 1958 Convention signatory countries (5). The devices considered in the study are 1) anti-lock braking systems (ABS), 2) electronic stability control (ESC), 3) seat belts, 4) front and side airbags, 5) side impact bars, side structure and protectors, 6) pedestrian protection, 7) child restraint systems, and 8) full-face motorcycle helmets. The analysis includes other promising devices that are rapidly being introduced in more mature economies, such as automated emergency braking systems (AEBS), due to their preventive potential based on emerging evidence.
The impact of each safety device was modeled using the estimated national incidence of road traffic injuries, the prevalence or use of the devices in each country, and the devices’ proven effectiveness, to calculate the reduction of deaths and DALYs if the safety devices were installed across the entire vehicle fleet and were widely used. The methodology adopted in this study was initially developed and applied in a study of six countries in the Region of the Americas, including Argentina, Brazil, Colombia, Ecuador, Mexico, and Uruguay (7). The same methodology was later refined and applied in more detailed studies in Uruguay (8) and in other regions of the world, including the 10 countries of the Association of Southeast Asian Nations (9). Details of the methodology and data used in this study are presented in the report following this summary and in the referenced publications (7, 8, 9).
Results
The study results show that 27.9% of the total 20,246 annual deaths in the 10 countries analyzed could be prevented by the UNECE-regulated vehicle safety devices, child restraint systems, and full-face helmets analyzed in this study. Figure 5 of this publication summarizes the percentage of deaths that could be avoided in each country for each device analyzed.
ESC with integrated ABS systems in all cars and motorcycles would provide the greatest benefit to all road users, with an estimated 18.47% (confidence interval [CI] of 14.96-21.97) reduction in deaths and a 17.15% (CI of 13.89-20.40) reduction in DALYs lost. Widespread seat belt use would prevent 12.38% (CI of 10.02-14.73) of deaths and 11.41% (CI of 9.24-13.57) of DALYs lost. Widespread use of UNECE-regulated full-face motorcycle helmets could reduce fatalities by 5.49% (CI of 4.44-6.52) and DALYs lost by 6.85% (CI of 5.55-8.15). All other devices analyzed would have a positive effect on reducing deaths and DALYs lost.
Conclusion
Reducing deaths and non-fatal injuries in road traffic crashes is feasible through widespread implementation of known, evidence-based, and proven effective tools. Based on evidence on the effectiveness of proven safety devices and recent information from the fifth WHO-coordinated Global Status Report on Road Safety, published in 2023, the study results quantify the preventive potential of adopting UNECE regulations on vehicle safety design and personal protective devices (seat belts, child restraint systems, and motorcycle helmets) to reduce deaths and disabilities caused by road traffic crashes in the 10 countries of the Region of the Americas analyzed.
These results complement previous studies conducted in six other countries in the Region and provide evidence to support PAHO’s strategies to accelerate the implementation of the Global Plan for the Second Decade of Action for Road Safety 2021-2030 in these priority countries. Given how long these safety devices have existed, their inclusion in international conventions and regulations, and the political will recently expressed by countries in the Region, their widespread adoption is soon expected to become a reality
References
- World Health Organization. Global Plan for the Decade of Action for Road Safety. Geneva: WHO; 2021.
- Pan American Health Organization. Status of Road Safety in the Region of the Americas. Washington, D.C.: PAHO; 2019.
- United Nations. Resolution A/RES/70/1. Sustainable Development Goals. Transforming our World: the 2030 Agenda for Sustainable Development. Seventieth UN General Assembly; 25 September 2015. New York: United Nations; 2015.
- United Nations. Resolution A/RES/74/299. Improving global road safety. Seventy-fourth General Assembly; 31 August 2020. New York: United Nations; 2020.
- United Nations Economic Commission for Europe (UNECE). World Forum for Harmonization of Vehicle Regulations (WP.29). 188th session of the World Forum for Harmonization of Vehicle Regulations; 9 to 12 March 2010. Geneva: UNECE; 2010.
- United Nations. Resolution A/76/L.70. Political declaration of the high-level meeting on improving global road safety. Seventy-sixth UN General Assembly; 30 June 2022. New York: United Nations; 2022.
- Bhalla K, Gleason K. Effects of vehicle safety design on road traffic deaths, injuries, and public health burden in the Latin American region: a modelling study. The Lancet Global Health. 2020;8(6):e819-e828.
- Ramos García JA, Furas A, Capurro A, Cabrera I, Cichevski N, Antona-Makoshi J, et al. Evaluación sobre la adhesión de Uruguay al Acuerdo de 1958. Montevideo, New York: Government of Uruguay, United Nations Development Program; 2022.
- Antona-Makoshi J, Muslim H, Medojevic M, Watanabe S, Seguí-Gómez M, Bhalla K. Estimated potential death and disability averted with vehicle safety interventions, Association of Southeast Asian Nations. Bulletin of the World Health Organization. 2023;101(3):211-222.
Methodology
This section presents a detailed description of the methodology used in this study, the results obtained, the study limitations, and a series of recommendations for improving future estimates.
Methodological approach
Figure A4.1 presents an outline of this study’s methodological approach. This approach consists of a counterfactual analysis applied to assess the number of deaths and disability-adjusted life years (DALYs) lost that could be avoided by adopting a range of vehicle safety devices across the entire vehicle fleet, along with the widespread use of UNECE-compliant seat belts, child restraint systems, and motorcycle helmets by all vehicle and motorcycle users, in 10 countries in the Region of the Americas, including Belize, Bolivia (Plurinational State of), Costa Rica, the Dominican Republic, El Salvador, Guatemala, Honduras, Jamaica, Nicaragua, and Paraguay.
Figure A4.1. This study’s methodological approach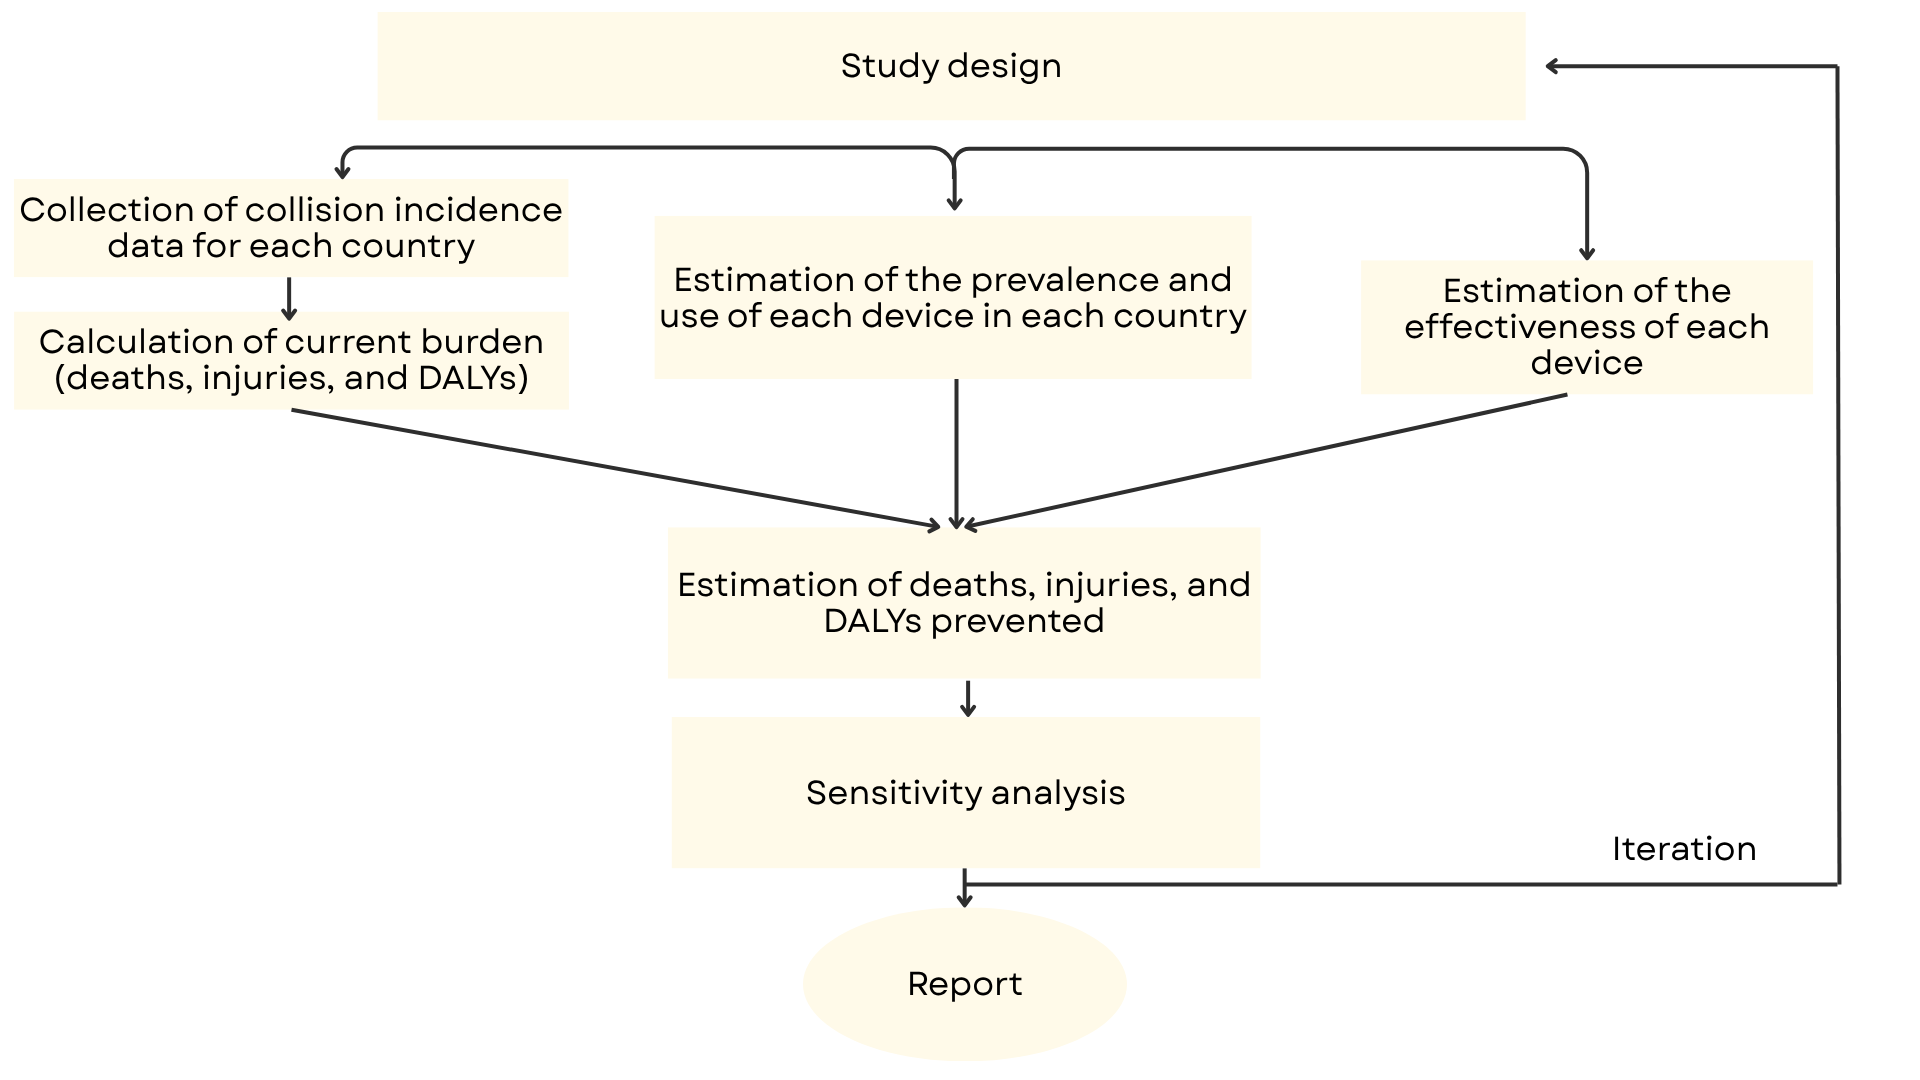
Source: Prepared by the authors.
This study’s methodology estimates: 1) the current incidence of road traffic injuries in each country and the burden suffered as a result of these injuries, 2) the prevalence and use of safety devices in each country, 3) the effectiveness of safety devices through a literature review, and 4) the number of deaths and DALYs lost that could be avoided if all vehicles and their occupants in the Region adopted these devices. The impact of uncertainty on the estimates was then assessed through a sensitivity analysis of the results using alternative model assumptions.
This methodology was initially developed and applied to a study conducted in six countries in the Region of the Americas, including Argentina, Brazil, Colombia, Ecuador, Mexico, and Uruguay (1). The same methodology was later refined and applied to more detailed studies conducted in Uruguay (2) and in other regions of the world, such as the 10 countries of the Association of Southeast Asian Nations (3).
Data on the incidence of fatal and non-fatal injuries
Official data from the World Health Organization (WHO)’s Global Health Estimates 2019 were used to define the incidence of fatal and non-fatal injuries from road traffic crashes in each analyzed country (4). The proportions of people killed by category (pedestrian, cyclist, motorcyclist, car and light truck occupants, other) were obtained from WHO health estimates (Figure A4.2). However, WHO health estimates do not contain proportions of non-fatal injuries by category, so these data was taken from estimates of disease burden, injuries, and risk factors (5).
Figure A4.2. Data on the incidence of road traffic deaths, by country and victim category, used for the baseline calculations for this study
Source: World Health Organization. Global Health Estimates 2019. Geneva: WHO; 2019 [Accessed 24 October 2024].
Calculation of the burden of road traffic injuries
To quantify the burden of road traffic injuries in the countries analyzed, the estimated number of deaths, injuries, and years of healthy life lost must be calculated, using DALYs. The DALY indicator was developed following the methodology of the Global Burden of Disease (GBD) study 2010 (6). It takes the matrices used by existing records in different countries to establish the relationship between external causes (crashes) and their consequences (injuries), including their severity and duration.
Bhalla and Harrison (7) developed a tool for calculating the burden of road traffic crashes, including information from 28 countries in Africa, the Americas, Asia, and Europe, to define all the parameters needed to apply the described methodology. This tool allows DALYs to be calculated using injury and death incidence data, making it possible to formulate an estimate for the countries studied, even if they do not have detailed administrative records on injury sequelae.
In this study, data on the incidence of fatal and non-fatal injuries were collected in each of the countries indicated in the previous section. In addition, the previously developed burden calculators and matrices (7) were used to calculate both the baseline of the current burden suffered by each country and the estimated burden after implementing the safety devices analyzed.
UN regulations and safety devices assessed
The safety devices analyzed in this study (Table A4.1) include anti-lock braking systems (ABS), electronic stability control (ESC), seat belts, front airbags, side airbags, side impact bars, side structure and protectors, optimized side impact protection systems, pedestrian protection, child restraint systems, and full-face motorcycle helmets. The safety of all these devices has been previously proven. The UNECE has regulated these devices and the 1958 Agreement signatory countries have adopted them in their entirety.
Table A4.1. Safety devices assessed, UN regulations related to these devices, and vehicle categories regulated by these regulations
Regulations |
Aspect regulated by each regulation |
Devices assessed |
Vehicle categories |
R13H |
Brakes for M1 and N1 category vehicles |
Anti-lock braking system |
M1, N1 |
R140 |
Electronic stability control |
Electronic stability control (ESC) |
M, N, L |
R14 |
Seat belt anchors |
Seat belts |
M1, N1 |
R16 |
Seat belts |
||
R94 |
Occupant protection in the event of frontal impact |
Front airbag |
M1, N1 |
R95 |
Occupant protection in the event of side impact |
Side airbag |
M1, N1 |
R135 |
Pole side impact protection |
Side impact bar |
M1, N1 |
Side structure and protectors |
M1, N1 |
||
Optimized side impact protection system |
M1, N1 |
||
R127 |
Pedestrian protection |
Pedestrian protection |
M1, N1 |
R44 |
Child restraint systems |
Child restraint systems |
M |
R22 |
Helmets and visors for motorcycle drivers and passengers |
Full-face helmets |
L |
R131 |
Advanced emergency braking systems for heavy vehicles |
Advanced emergency braking systems (AEBS) |
M1, N1, L |
R152 |
Advanced emergency braking systems for M1 and N1 category vehicles |
Note: For vehicle categories, see United Nations Economic Commission for Europe (UNECE). Resolution ECE/TRANS/WP.29/78/Rev.6. Consolidated Resolution on the Construction of Vehicles (R.E.3). Inland Transport Committee, Working Party on the Construction of Vehicles (WP.29); 2023. Geneva: United Nations; 2023.
Source: Adapted from Ramos-Garcia et al. 2021 (23).
Collision configuration
Different safety devices help reduce the risk of injury in various types of collisions. For example, front airbags and seat belts are particularly effective in reducing the risk of injury in predominantly frontal collisions, while side airbags or side structure and protectors are effective mainly in side collisions. Collision configuration data (e.g., frontal, side, rear-end, etc.) is therefore needed to estimate the potential impact of different devices.
The death and injury incidence data obtained from the aforementioned international sources contain information on vehicle type (such as cars and light trucks, motorcycles) and victim category (such as pedestrian or motorcyclist), stratified by age and sex. However, they do not provide detailed information on the collision configuration of the cars (i.e., frontal or side collisions). In the absence of these data in the countries analyzed, and as proposed by the reference studies (1-3), collision configuration data from the United States of America were taken to estimate the proportion of deaths and injuries among car and light truck occupants in different collision configurations.
Safety device penetration and use
The safety device penetration and use data used in this study’s estimates were taken from various sources, mainly consultations with each country’s data providers for the WHO’s fifth Global status report on road safety, published in 2023. Generally speaking, only reliable primary sources were found for all countries analyzed regarding seat belt and motorcycle helmet use, as well as the use of child restraint systems in Costa Rica.
In the absence of data on the penetration of ABS, ESC, front airbags, side airbags, side structure, and side impact bars, the estimated average values obtained from previous studies in several countries in the Region (1,2) were used.
Table A4.2 summarizes the penetration data identified for seat belts, child restraint systems, and motorcycle helmets, as well as the averages obtained from other countries in the Region that were used for this study’s estimates.
Table A4.2. Penetration of each safety device analyzed by country
Country |
ABS |
ESC |
Seat belt use in drivers (D) and passengers (P) Driver (Passenger) |
Child restraint system |
Front airbag |
Side airbag |
Side impact bar |
Side structure and protectors |
Pedestrian protection |
Use of motorcycle helmet |
- |
- |
60% (30%) |
- |
- |
- |
- |
- |
- |
80% |
|
- |
- |
4% (1%) |
- |
- |
- |
- |
- |
- |
52% |
|
- |
- |
75% (36%) |
31% |
- |
- |
- |
- |
- |
98% |
|
The Dominican Republic |
- |
- |
18% (5%) |
- |
- |
- |
- |
- |
- |
27% |
- |
- |
51% (20%) |
- |
- |
- |
- |
- |
- |
30% |
|
- |
- |
61% (61%) |
- |
- |
- |
- |
- |
- |
36% |
|
- |
- |
80% (10%) |
- |
- |
- |
- |
- |
- |
60% |
|
- |
- |
54% (4%) |
- |
- |
- |
- |
- |
- |
26% |
|
- |
- |
92% (92%) |
- |
- |
- |
- |
- |
- |
95% |
|
- |
- |
65% (21%) |
- |
- |
- |
- |
- |
- |
34% |
|
Average |
40% |
13% |
- |
10% |
40% |
10% |
75% |
5% |
10% |
- |
Note: ABS: anti-lock braking system; ESC: electronic stability control.
Source: Prepared by the authors.
Relative risks
Estimates of the relative risk (RR) associated with the different safety devices analyzed in this study were based on a published systematic study, (1) which was subsequently complemented by a review of the effectiveness of motorcycle helmets and AEBS (2,3).
Table A4.3 summarizes the evidence used to estimate the RR associated with each device, including the differentiation between car and light truck occupants, and other road users analyzed in this study.
Table A4.3. Relative risk associated with each safety device
Safety device |
Car and light truck occupants |
Pedestrians, cyclists, and motorcyclists |
Anti-lock braking system (ABS) |
||
Prevents loss of steering control due to skidding on motorcycles and other vehicles. Uses sensors to detect wheel lockup during braking maneuvers and applies brake release, hold, and re-apply cycles to unlock the wheels. |
RR of deaths and non-fatal injuries for cars and light truck occupants in single-vehicle and multi-vehicle crashes (8). |
RR of pedestrian deaths (8); RR of motorcyclist deaths (9); RR of non-fatal motorcyclist injuries (10). |
Electronic stability control (ESC) |
||
Uses sensors to monitor the speed of each wheel to detect loss of traction and applies brakes to individual wheels, to maintain control of the vehicle. All vehicles with ESC also include ABS. |
RR of deaths and non-fatal injuries for car and light truck occupants (11). |
RR of pedestrian deaths and non-fatal injuries (11); RR for motorcyclists based on estimated motorcycle ABS (9,10). |
Seat belts |
||
In the event of a collision, they reduce the likelihood of the occupant making contact with the vehicle interior, distribute forces over large parts of the body, and prevent the occupant from being thrown from the vehicle. |
RR of occupant deaths and injuries in frontal collisions (12). |
|
Front airbag |
||
Complements seat belts and prevents direct contact between occupants and the vehicle interior in frontal collisions. |
RR of occupant deaths and non-fatal injuries in frontal collisions (11). |
|
Side airbag |
||
Complements side structures and prevents contact between occupants and the vehicle interior in side collisions. |
RR of deaths and injuries from side collisions due to front and side airbags (13). |
|
Side impact bar |
||
Provides additional structural integrity in the event of side collisions. |
RR of deaths in collisions in the United States of America (11). This also applies to non-fatal injuries. |
|
Side structure and protectors |
||
Reduce intrusion and increase energy absorption, respectively, in side impacts. |
RR of deaths and non-fatal injuries in side collisions (11). |
|
Optimized side impact protection system |
||
Ensure that the airbags work alongside other side collision systems. |
RR of deaths in vehicles with the highest rating in standardized crash tests, compared to vehicles with the lowest rating (14). |
|
Pedestrian protection |
||
Car and light truck designs that modify the stiffness and energy absorption of the bumper, hood, windshield, and A-pillar. |
|
RR of deaths and injuries (15, 16) for cars and light trucks with a three-star rating or higher versus a zero rating in Euro NCAP pedestrian protection tests. |
Combined effect of vehicle design |
||
Estimates the combined effect of all vehicle devices. |
RR for occupant deaths and injuries in cars sold in the United States in 2015 compared to 1990 (11). |
RR for pedestrian deaths and non-fatal injuries (15, 16). Applied to collisions with cars. RR for deaths and non-fatal injuries on motorcycles with ABS (14,10). |
Child restraint systems |
||
In the event of a collision, they restrain children, reduce the likelihood of contact with the vehicle interior, distribute forces over wide parts of the body, and prevent the child from being thrown from the vehicle. |
RR for child occupant deaths and injuries in frontal and side collisions (17-19). |
|
Full-face motorcycle helmets |
||
Protect the motorcyclist from injury by reducing the amount of energy transferred to the head in the event of impact. |
|
RR of death and injury among motorcyclists with and without full-face helmets (20). |
Advanced emergency braking systems (AEBS) |
||
Continuously monitor the traffic ahead of the vehicle and autonomously apply the brakes if they detect an imminent collision risk to which the driver fails to react. |
RR of injuries from rear-end collisions between vehicles (21) and in collisions between cars at intersections (22). |
RR of collisions between vehicles and pedestrians (23, 24). |
Note: RR: relative risk.
Source: Adapted from Bhalla K, Gleason K. Effects of vehicle safety design on road traffic deaths, injuries, and public health burden in the Latin American region: a modelling study. The Lancet Global Health. 2020;8(6):e819-e828.
Analytical approach for estimating the reduction in deaths and burden
The methodological approach applied in this study consists of a counterfactual analysis to evaluate the reduction in deaths, fatal and non-fatal injuries, and DALYs lost due to road traffic collisions, if the aforementioned safety devices were fully employed in the countries analyzed (Table A4.1).
For each risk factor (e.g., motorcyclist crash death) and tested safety device analyzed (e.g., motorcycle helmet), the expected proportional reduction in mortality or morbidity is calculated if exposure to the current risk factor were reduced to an alternative distribution, by increasing the prevalence or current use of the safety device to a prevalence of 100% and the corresponding risk reduction through the previously defined RR (Table A4.3).
For more technical details on the analytical approach used, we recommend reviewing the reference studies (1-3).
Sensitivity analysis
There is substantial uncertainty associated with several data inputs in the model. To assess the impact of this uncertainty on the estimates, a sensitivity analysis was conducted in which the calculations were redone under alternative model assumptions. Table A4.4 summarizes the values applied for the main estimates and the sensitivity analysis. The minimum and maximum values derived from modeling all possible combinations of the main estimate variations are included.
Table A4.4. Uncertainty in input data estimates and assumptions adopted to model the main estimates and sensitivity analysis
|
Main estimation modeling |
Sensitivity analysis modeling |
Uncertainty in baseline estimates of road traffic injuries |
||
The incidence of road traffic deaths and injuries in the studied countries varies substantially between sources. |
The incidence of deaths and injuries and death proportions are based on WHO Global Health Estimates (4). Injury proportions are based on Global Burden of Disease (GBD) estimates (5). |
Maximum and minimum 95% confidence intervals are included. Deaths and injuries are modelled according to the Global Burden of Disease (GBD) (5). |
Uncertainty in safety device penetration estimates |
||
There is no information available on devices in the countries analyzed for ABS, ESC, front airbags, side airbags, side structure, and side impact bars. |
The estimated prevalence of safety devices in a vehicle fleet is calculated as the average of five countries in the Region from a previous study (1). |
Maximum and minimum 95% confidence intervals of the averages used are included. |
Uncertainty in relative risk estimates |
||
Estimates from the RR literature vary substantially due to variation in the quality and type of studies. |
The mean RR estimate is derived from more robust assessments of the main or best estimate. |
Maximum and minimum 95% confidence intervals for RR are included for each safety device. |
Note: ABS: anti-lock braking system; ESC: electronic stability control; RR: relative risk.
Source: Prepared by the authors.
Results
Current crash burden and reduction in deaths and burden by country
According to WHO global estimates (
Figure A4.3. Estimated reduction in deaths by country
Source: Prepared by the authors.
Figure A4.4. Estimated reduction in DALYs lost by country
Source: Prepared by the authors.
Reduction in deaths by safety device and by country
Table A4.5 and Figure A4.5 show road traffic deaths for the study period by victim category for all countries analyzed in this study. They also show the estimated total percentage of deaths that could be avoided by each safety device analyzed.
Overall, for all countries analyzed, the proven safety devices with the greatest preventive potential are ESC systems with in-built ABS, which could prevent 18.5% of deaths (15%-22%), followed by seat belts with 12.4% (10%-14.7%), optimized side impact systems with 7.8% (6.3%-9.3%), and full-face motorcycle helmets with 5.5% (4.4%-6.5%). The other devices analyzed would also help reduce road traffic deaths.
Table A4.5. Estimated current road traffic deaths and reduction in deaths by safety device and country
| Belize | Bolivia | Costa Rica | The Dominican Rep. | El Salvador | Guatemala | Honduras | Jamaica | Nicaragua | Paraguay | TOTAL | |
|---|---|---|---|---|---|---|---|---|---|---|---|
| Annual road traffic deaths | |||||||||||
| Pedestrians | 15 | 779 | 254 | 1,013 | 718 | 1,984 | 709 | 127 | 479 | 524 | 6,603 |
| Cyclists | 15 | 22 | 92 | 615 | 95 | 173 | 81 | 60 | 61 | 32 | 1,247 |
| Motorcyclists | 20 | 239 | 193 | 1,074 | 156 | 524 | 84 | 94 | 200 | 749 | 3,332 |
| Cars and light trucks | 35 | 1,374 | 188 | 3,751 | 206 | 1,167 | 590 | 133 | 301 | 236 | 7,980 |
| Other | 3 | 15 | 17 | 483 | 171 | 178 | 108 | 30 | 69 | 10 | 1,084 |
| Total | 88 | 2,429 | 745 | 6,936 | 1,346 | 4,026 | 1,572 | 444 | 1,108 | 1,551 | 20,246 |
| Estimated prevented deaths | |||||||||||
| Anti-lock braking system | 13.0% | 10.1% | 14.3% | 10.7% | 10.6% | 11.2% | 9.1% | 12.7% | 12.2% | 19.5% | 11.6% |
| Electronic stability control | 20.1% | 18.8% | 20.0% | 19.1% | 14.6% | 17.0% | 15.5% | 18.7% | 17.8% | 24.8% | 18.5% |
| Seat belts | 13.1% | 24.2% | 5.6% | 17.2% | 4.9% | 8.0% | 6.0% | 9.2% | 2.4% | 4.2% | 12.4% |
| Front airbag | 5.0% | 7.2% | 3.2% | 6.9% | 1.9% | 3.7% | 4.8% | 3.8% | 3.4% | 1.9% | 5.0% |
| Side airbag | 3.5% | 5.1% | 2.3% | 4.8% | 1.4% | 2.6% | 3.4% | 2.7% | 2.4% | 1.4% | 3.5% |
| Side impact bar | 0.5% | 0.8% | 0.3% | 0.7% | 0.2% | 0.4% | 0.5% | 0.4% | 0.4% | 0.2% | 0.5% |
| Side structure and protectors | 2.0% | 2.9% | 1.3% | 2.7% | 0.8% | 1.5% | 1.9% | 1.5% | 1.4% | 0.8% | 2.0% |
| Optimized side system | 7.9% | 11.2% | 5.0% | 10.7% | 3.0% | 5.8% | 7.4% | 5.9% | 5.4% | 3.0% | 7.8% |
| Pedestrian protection | 2.8% | 5.3% | 5.7% | 2.4% | 8.9% | 8.2% | 7.5% | 4.8% | 7.2% | 5.6% | 5.4% |
| Child restraint systems | 1.2% | 3.4% | 0.5% | 1.2% | 0.3% | 0.5% | 0.7% | 1.1% | 0.5% | 0.2% | 1.1% |
| Full-face motorcycle helmet | 5.2% | 3.3% | 2.4% | 6.4% | 4.8% | 4.9% | 1.8% | 8.7% | 1.6% | 19.9% | 5.5% |
| Automated emergency braking system | 9.8% | 11.0% | 9.7% | 9.2% | 9.4% | 10.3% | 10.5% | 9.5% | 9.7% | 8.4% | 10.0% |
Bolivia (Plurinational State of), the Dominican Republic, and, to a lesser extent, Belize, could particularly benefit from car and light truck safety devices, including seat belts, front and side airbags, and optimized side impact systems. Seat belts alone could prevent a large number of deaths, with estimates of 24.2% (19.6%-28.8%) of total crashes in Bolivia (Plurinational State of), 17.2% (13.9%-20.5%) in the Dominican Republic, and 13.1% (10.6%-15.6%) in Belize (Table A4.5). This is due to the high proportion of car and light truck occupants in crashes reported by these countries (56.6% in Bolivia [Plurinational State of], 54.1% in the Dominican Republic, and 39.7% in Belize; see Figure A4.2 or Table A4.5), in combination with low seat belt use (4% in Bolivia [Plurinational State of], 18% in the Dominican Republic, and 60% in Belize, in Table A4.2).
El Salvador, Guatemala, and Honduras could particularly benefit from pedestrian safety devices by improving the front-end design of all cars and light trucks, as these countries reported a particularly high proportion of pedestrian deaths, accounting for 52.3%, 49.3%, and 45.1% of each country’s total, respectively. Specifically, by improving the design of cars and light trucks, a reduction of 8.9% (7.2%-10.6%) in total deaths could be achieved in El Salvador, 8.2% (6.6%-9.8%) in Guatemala, and 7.5% (6.1%-8.9%) in Honduras, as shown in Table A4.5.
Figure A4.5. Estimated percentage reduction in deaths according to safety device used and country
Source: Prepared by the authors.
In Paraguay, the high proportion of motorcyclist deaths (48.3% of the total) makes measures affecting their safety particularly effective. Specifically, increasing motorcycle helmet use from the current 34% to 100% could prevent 19.9% of the country’s current deaths. Similar patterns are observed in Jamaica, which has a relatively high proportion of motorcyclist deaths (21.7% of the total) and relatively low helmet use (26%). Widespread use of motorcycle helmets here could reduce deaths by 8.7% (7.1%-10.4%).
Finally, Nicaragua reported high rates of seat belt use (92%) and motorcycle helmet use (95%). This means that the margins for improvement associated with these devices are smaller than in other countries. Vehicle safety devices such as ESC and pedestrian protection would provide greater relative benefits, and could reduce deaths by 17.8% (14.4%-21.2%) and 7.2% (5.8%-9.6%), respectively.
Table A4.6 ranks the most effective safety devices in preventing deaths in each of the countries analyzed. It is worth mentioning that the effectiveness of different safety devices is not additive, since some are redundant in protecting the same type of road users. For example, seat belts and optimized side impact systems are redundant in protecting car and light truck occupants, but provide no benefit to pedestrians or motorcyclists. As such, strategies defined solely on the ranking presented in the table, without considering redundancy between safety devices, could be suboptimal for preventing the highest possible number of victims. Therefore, additional considerations are required.
Table 6: Ranking of the most effective safety devices for each country analyzed
|
Priority 1 |
Priority 2 |
Priority 3 |
Priority 4 |
Belize |
ESC with ABS: 20.1% |
Seat belts: 13.1% |
Optimized side impact systems: 7.9% |
Full-face motorcycle helmet: 5.2% |
Bolivia |
Seat belts: 24.2% |
ESC with ABS: 18.8% |
Optimized side impact systems: 11% |
Front airbag: 7.2% |
Costa Rica |
ESC with ABS: 20% |
Pedestrian protection: 5.7% |
Seat belts: 5.6% |
Optimized side impact systems: 5% |
The Dominican Republic |
ESC with ABS: 19.1% |
Seat belts: 17.2% |
Optimized side impact systems: 10.7% |
Front airbag: 6.9% |
El Salvador |
ESC with ABS: 14.6% |
Pedestrian protection: 8.9% |
Seat belts: 4.9% |
Full-face motorcycle helmet: 4.8% |
Guatemala |
ESC with ABS: 17% |
Pedestrian protection: 8.2% |
Seat belts: 8% |
Full-face motorcycle helmet: 4.9% |
Honduras |
ESC with ABS: 15.5% |
Pedestrian protection: 7.5% |
Optimized side impact systems: 7.4% |
Seat belts: 6% |
Jamaica |
ESC with ABS: 18.7% |
Seat belts: 9.2% |
Full-face motorcycle helmet: 8.7% |
Optimized side impact systems: 5.9% |
Nicaragua |
ESC with ABS: 17.8% |
Pedestrian protection: 7.2% |
Optimized side impact systems: 5.4% |
Front airbag: 3.4% |
Paraguay |
ESC with ABS: 24.8% |
Full-face motorcycle helmet: 19.9% |
Pedestrian protection: 5.6% |
Seat belts: 4.2% |
Source: Prepared by the authors.
Reduction in burden by safety device and country
Table A4.7 and Figure A4.6 show the results of the estimated DALYs lost in road traffic crashes by victim category for all countries analyzed in this study. The estimated total percentage of DALYs that could be prevented by each safety device in each country is also shown.
Table A4.7. Estimated preventable DALYs by safety device and country
Category |
Belize |
Bolivia |
Costa Rica |
The Dominican Rep. |
El Salvador |
Guatemala |
Honduras |
Jamaica |
Nicaragua |
Paraguay |
TOTAL |
Annual DALYs lost in road traffic crashes |
|||||||||||
Pedestrian |
914 |
43,056 |
14,498 |
49,209 |
36,489 |
104,227 |
37,759 |
6,856 |
22,625 |
24,716 |
340,349 |
Cyclist |
998 |
1,257 |
5,914 |
47,883 |
4,803 |
13,273 |
4,160 |
3,145 |
3,216 |
1,519 |
86,169 |
Motorcyclist |
1,242 |
13,683 |
12,301 |
62,873 |
8,077 |
39,909 |
4,972 |
5,468 |
13,757 |
47,564 |
209,847 |
Cars and light trucks |
2,227 |
77,389 |
12,054 |
200,662 |
10,533 |
62,790 |
34,455 |
7,559 |
17,030 |
14,755 |
439,453 |
Other |
194 |
819 |
1,076 |
25,941 |
9,207 |
16,186 |
6,365 |
1,875 |
4,211 |
547 |
66,422 |
Total |
5,574 |
136,204 |
45,842 |
386,568 |
69,110 |
236,384 |
87,712 |
24,904 |
60,839 |
89,102 |
1,142,239 |
Estimated DALYs lost prevented (%) |
|||||||||||
Anti-lock braking system |
12.3 |
9.5 |
12.7 |
10.1 |
8.7 |
10.7 |
8.0 |
11.6 |
12.1 |
20.0 |
11.0 |
Electronic stability control |
18.6 |
17.3 |
17.6 |
17.6 |
12.2 |
15.8 |
13.9 |
16.9 |
17.4 |
25.2 |
17.1 |
Seat belts |
12.4 |
21.6 |
5.4 |
15.7 |
4.6 |
7.1 |
6.0 |
8.5 |
2.3 |
4.4 |
11.4 |
Front airbag |
4.4 |
6.5 |
2.8 |
6.1 |
1.8 |
3.3 |
4.7 |
3.4 |
3.3 |
1.8 |
4.5 |
Side airbag |
3.9 |
5.4 |
2.6 |
4.9 |
1.4 |
2.4 |
3.7 |
2.9 |
2.6 |
1.6 |
3.6 |
Side impact bar |
0.6 |
0.8 |
0.4 |
0.7 |
0.2 |
0.4 |
0.6 |
0.4 |
0.4 |
0.2 |
0.5 |
Side structure and protectors |
2.2 |
3.0 |
1.5 |
2.7 |
0.8 |
1.4 |
2.1 |
1.7 |
1.5 |
0.9 |
2.0 |
Optimized side system |
8.6 |
12.0 |
5.8 |
10.8 |
3.2 |
5.3 |
8.1 |
6.5 |
5.8 |
3.5 |
8.0 |
Pedestrian protection |
2.7 |
5.3 |
5.3 |
2.1 |
8.8 |
7.3 |
7.2 |
4.6 |
6.2 |
4.6 |
5.0 |
Child restraint systems |
1.8 |
5.5 |
0.8 |
1.8 |
0.5 |
0.7 |
1.2 |
1.9 |
0.8 |
0.3 |
1.7 |
Full-face motorcycle helmet |
5.9 |
3.7 |
3.2 |
7.3 |
5.2 |
7.2 |
2.1 |
10.0 |
2.5 |
23.7 |
6.9 |
Automated emergency braking system |
12.0 |
13.0 |
12.1 |
10.7 |
10.0 |
10.5 |
11.4 |
11.2 |
10.7 |
9.9 |
11.2 |
Figure A4.6. Estimated reduction in DALYs by safety device and country
The overall trends in DALYs prevented for all devices are similar to those for mortality reduction, but one aspect related to child restraint systems is worth highlighting.
For these systems, there is a considerable difference between the results of DALY and death prevention, with a relative increase of 54% (1.7 DALYs versus 1.1 deaths). This difference is due to the fact that, unlike deaths, DALYs consider the years lost and years lived with disability. Both are much greater for child victims, as they have longer life expectancies than older deceased or injured victims. A similar effect is observed in the relative difference of 25.4% (6.9 DALYs versus 5.5 deaths) between DALYs and deaths prevented by full-face motorcycle helmets, due to the fact that these types of crashes are predominant among the younger population.
Preliminary assessment of automated emergency braking systems
The results of the AEBS assessment are presented in the last column of Table A4.5 and Table A4.7, respectively, and are analyzed separately in this section.
This analysis is done separately since the effectiveness of AEBS has only been tested by international epidemiological studies to prevent rear-end collisions between cars at relatively low speeds of up to 60 kilometers per hour, regulated by the UNECE (R131 and R152 in Table A4.1). Although there are preliminary studies on these devices’ significant potential to prevent frontal collisions between cars at higher speeds, collisions between cars at intersections, and collisions between cars and pedestrians, cyclists, or motorcyclists (22, 24) —in which deaths and serious injuries are more likely— the evidence on the effectiveness of these devices is yet to be consolidated.
With these limitations in mind, it was decided to preliminarily include the devices into this study with optimistic predictions of their potential, based on simulation studies (22, 23). Figure A4.7 presents the estimated number of deaths that could be prevented with widespread use of ABS and ESC (which includes ABS), and AEBS (which includes ESC and ABS), based on these predictions.
Figure A4.7. Estimated percentage of deaths prevented by anti-lock braking systems (ABS), electronic stability control (ESC) with in-built ABS, and automated emergency braking systems (AEBS) with in-built ESC and ABS.
Source: Prepared by the authors.
These preliminary results confirm these devices’ potential and suggest their inclusion in future studies that consider these safety devices.
Limitations of this study and recommended future improvements.
Like almost all impact assessments, this study is not without its limitations. Most of these are related to the reliability or lack of data needed for the models used. These limitations are outlined below, along with an assessment of their impact on the results and recommendations for the future:
Detailed collision configuration data for each country analyzed. In the absence of detailed collision configuration data, it was decided to include collision configurations between cars from the United States, as in the reference studies (1-3). We recommend that collision data collection systems be improved in all countries included in this study, including details on collision configurations. This task falls under the remit of the Ibero-American Road Safety Observatory, which is part of the Ibero-American General Secretariat Road Safety Program, involving most countries in this study.
Data on safety device penetration in each country analyzed. Given the scarcity of data on the penetration of many of the safety devices studied, it was decided to use averages from other countries in the Region, with the corresponding sensitivity analysis. We recommend working with the industry and relevant institutions in each country to improve the collection and publication of this type of data. One task that could be replicated in other countries in the Region is carried out by El Poder del Consumidor in Mexico (25). This organization regularly collects and publishes detailed data on the availability of ESC, airbags, child restraint system anchors, and AEBS, amongst other devices, in Mexico’s current vehicle fleet. Regional Road Safety Observatories, including the Ibero-American Road Safety Observatory, plan to increase vehicle registration in member countries. We advise that this be implemented as soon as possible.
More detailed data on types of motorcycle helmet and their correct use. The effectiveness of motorcycle helmets varies depending on the type of helmet (full-face, half-helmet, etc.), their correct use (tight fit, closed strap), and their quality (certified, non-certified, etc.). The current study included available data on helmet use for all countries studied. However, this information does not differentiate between the type, quality, or correct use of helmets. Numerous initiatives in the Region, such as the Helmet Coalition (2022) in Mexico and the Gonzalo Rodríguez Foundation (2017) in Uruguay, include improving data collection on type of helmet and their correct use. In particular, data provided by this last initiative in Uruguay enabled accurate studies on the impact of certified, full-face helmets in the country (2). Another recent example is the International Automobile Federation’s awareness campaigns on low-cost, certified helmets in several of these countries.
More accurate data on the availability of child restraint systems and their correct use. In this study, specific data on the use of child restraint systems was collected only for Costa Rica. For the remaining countries, the average obtained from five other countries in the Region was used (Table A4.2). Future studies in the Region would benefit from country-specific data on child restraint systems, including details on the types of systems used by age group, the availability of secure attachment anchors, and their correct use. We also advise comparing self-reported figures on the use of child restraint systems with those reported in studies conducted by entities such as the European Safety and Reliability Association in some of these countries.
Evidence on the effectiveness of AEBS. As discussed in the previous section, evidence on the effectiveness of AEBS for high-speed frontal collisions between cars, collisions between cars at intersections, and collisions between cars and pedestrians, cyclists, or motorcyclists is not consolidated. We recommend monitoring the development of these devices in other countries and including them in future detailed studies.
Evidence on other promising devices. In addition to AEBS, other promising devices are rapidly penetrating most high-income countries. Examples include lane departure warning systems, lane keeping assist systems, and emergency lane keeping systems. Preliminary studies on these systems’ potential to prevent collisions have been conducted, but evidence based on epidemiological studies is yet to be consolidated. We recommend monitoring the development of these types of systems in other countries and possibly including them in future studies. Evidence of the effectiveness of safety features in two- and three-wheeled motor vehicles, which are common in these countries, also requires further research.
Conclusions
Reducing deaths and non-fatal injuries caused by road traffic crashes is feasible with the widespread implementation of known and proven effective tools. Based on evidence on the effectiveness of proven safety devices and recent information from the fifth WHO-coordinated Global Status Report on Road Safety, published in 2023, this study demonstrates the preventive potential of adopting UNECE regulations on vehicle safety design and personal protective devices (seat belts, child restraint systems, and motorcycle helmets) to reduce deaths and disability caused by road traffic crashes in the 10 countries of the Region of the Americas analyzed.
These results complement previous studies in six other countries in the Region of the Americas and provide evidence to support PAHO’s strategies to implement the Global Plan for the Second Decade of Action for Road Safety 2021-2030 in these priority countries. Given how long these safety devices have been in use, their inclusion in international conventions and regulations, and the political will recently expressed by countries in the Region, their widespread adoption is soon expected to become a reality
References
- Bhalla K, Gleason K. Effects of vehicle safety design on road traffic deaths, injuries, and public health burden in the Latin American region: a modelling study. Lancet Glob Health. 2020;8(6):e819-e828.
- Ramos-Garcia JA, Furas A, Capurro A, Cabrera I, Cichevski N, Antona-Makoshi J, et al. Evaluación sobre la adhesión de Uruguay al Acuerdo de 1958. Montevideo: Government of Uruguay; 2022.
- Antona-Makoshi J, Muslim H, Medojevic M, Watanabe S, Seguí-Gómez M, Bhalla K. Estimated potential death and disability averted with vehicle safety interventions, Association of Southeast Asian Nations. Bull World Health Organ. 2023;101(3), 211-222.
- World Health Organization. Global Health Estimates 2019. Geneva: WHO; 2019 [accessed 24 October 2024].
- Global Burden of Disease Collaborative Network. Global burden of disease study 2019 (GBD 2019). Results. Seattle: Institute for Health Metrics and Evaluation; 2021.
- Institute for Health Metrics and Evaluation. The Global Burden of Disease: Generating Evidence, Guiding Policy. Seattle, WA: University of Washington; 2013.
- Bhalla K, Harrison JE. Burden calculator: a simple and open analytical tool for estimating the population burden of injuries. Inj Prev. 2016; 22(suppl 1):i23-i26.
- National Highway Traffic Safety Administration. The long-term effects of ABS in passenger cars and LTVs. Washington, DC; NHTSA; 2009.
- Teoh ER. Effects of antilock braking systems on motorcycle fatal crash rates: An update. May 2013. Insurance Institute for Highway Safety; 2013.
- Rizzi M, Strandroth J, Kullgren A, Tingvall C, Fildes B. Effectiveness of motorcycle antilock braking systems (ABS) in reducing crashes, the first cross-national study. Traffic Inj Prev. 2015;16(2):177-183.
- National Highway Traffic Safety Administration. Lives saved by vehicle safety technologies and associated federal motor vehicle safety standards, 1960 to 2012—Passenger cars and LTVs (Report No. DOT HS 812 069). Washington, D.C.: NHTSA; 2015.
- Elvik R, Høye A, Vaa T, Sørensen M. Vehicle design and protective devices. In: The handbook of road safety measures. Leeds: Emerald Group Publishing Limited; 2009.
- McCartt AT, Kyrychenko SY. Efficacy of side airbags in reducing driver deaths in driver-side car and SUV collisions. Traffic Inj Prev. 2007;8(2):162-170.
- Teoh ER, Lund AK. Traffic Inj Prev. 2011 Oct;12(5):500-507.
- Strandroth J, Rizzi M, Sternlund S, Lie A, Tingvall C. The correlation between pedestrian injury severity in real-life crashes and Euro NCAP pedestrian test results. Traffic Inj Prev. 2011;12(6):604-613.
- Strandroth J, Sternlund S, Lie A, Tingvall C, Rizzi M, Kullgren A, et al. Correlation Between Euro NCAP Pedestrian Test Results and Injury Severity in Injury Crashes with Pedestrians and Bicyclists in Sweden. Stapp Car Crash J. 2014 Nov;58:213-31.
- Lee G, Pope CN, Nwosu A, McKenzie LB, Zhu M. Child passenger fatality: Child restraint system usage and contributing factors among the youngest passengers from 2011 to 2015. J Safety Res. 2019 Sep;70:33-38.
- Howard A, Rothman L, McKeag AM, Pazmino-Canizares J, Monk B, Comeau JL, et al. Children in side-impact motor vehicle crashes: seating positions and injury mechanisms. J Trauma. 2004;56(6):1276-1285.
- Durbin DR, Chen I, Smith R, Elliott MR, Winston FK. Effects of seating position and appropriate restraint use on the risk of injury to children in motor vehicle crashes. Pediatrics. 2005;115(3):e305-e309.
- Liu BC, Ivers R, Norton R, Boufous S, Blows S, Lo SK. Helmets for preventing injury in motorcycle riders. Cochrane Database Syst Rev. 2008;23;(1):CD004333.
- Leslie AJ, Kiefer RJ, Meitzner MR, Flannagan CA. Field effectiveness of general motors advanced driver assistance and headlighting systems. Accid Anal Prev. 2021;159:106275.
- Sander, U. Predicting Safety Benefits of Automated Emergency Braking at Intersections-Virtual simulations based on real-world accident data. Gothenburg: Chalmers University of Technology; 2018.
- Saadé J. Autonomous Emergency Braking AEB (pedestrians and cyclists). Loughborough, United Kingdom: UK European Road Safety Decision Support System, SafetyCube; 2017.
- Partnership for Analytics Research in Traffic Safety. Real-world effectiveness of Model Year 2015–2020 advanced driver assistance system. Washington, D.C.: NHTSA; 2022.
- El Poder del Consumidor. Qué tan seguro es tu auto. 2023.
Footnotes
1 Informe sobre el estado de la seguridad vial en la Región de las Américas, 2009. Available from: https://www.paho.org/es/documentos/informe-sobre-estado-seguridad-vial-region-americas-2009.
Report on Road Safety in the Region of the Americas, 2015. Available from: https://iris.paho.org/handle/10665.2/28560.
Road Safety in the Americas, 2016. Available from: https://www.paho.org/en/documents/road-safety-americas.
2 Participating countries: Antigua and Barbuda, Argentina, the Bahamas, Barbados, Belize, Bolivia (Plurinational State of), Brazil, Canada, Chile, Colombia, Costa Rica, Cuba, Dominica, the Dominican Republic, Ecuador, El Salvador, Guatemala, Guyana, Haiti, Honduras, Jamaica, Mexico, Nicaragua, Panama, Paraguay, Peru, Saint Lucia, Suriname, Trinidad and Tobago, the United States of America, Uruguay, and the Virgin Islands (territory).