Key messages
- In 2021, in the Region of the Americas, an estimated 145,090 people died from road traffic crashes, representing 12% of all deaths worldwide.
- In that year, the road traffic mortality rate was 14.09 per 100,000 inhabitants.
- Despite numerous efforts, there were no significant changes in the number of deaths (a reduction of only 0.11%, or 165 deaths) or mortality rate (a decrease of 9.37%) between 2010 and 2021.
- The figures highlight a stark inequality, with the risk of dying considerably higher in certain areas than in others.
- Nine countries (Argentina, Brazil, Canada, Chile, Cuba, Mexico, Panama, Trinidad and Tobago, and Uruguay) managed to reduce road traffic deaths between 2010 and 2021.
- North America and the Latin Caribbean face a growing challenge, with mortality rates increasing from 11.1 to 13.2, and 16.4 to 20.6, per 100,000 inhabitants, respectively, between 2010 and 2021.
- In the Southern Cone and the Andean region, the mortality rate per 100,000 inhabitants fell significantly from 20.1 to 14.3, and 19.0 to 15.8, respectively, between 2010 and 2021.
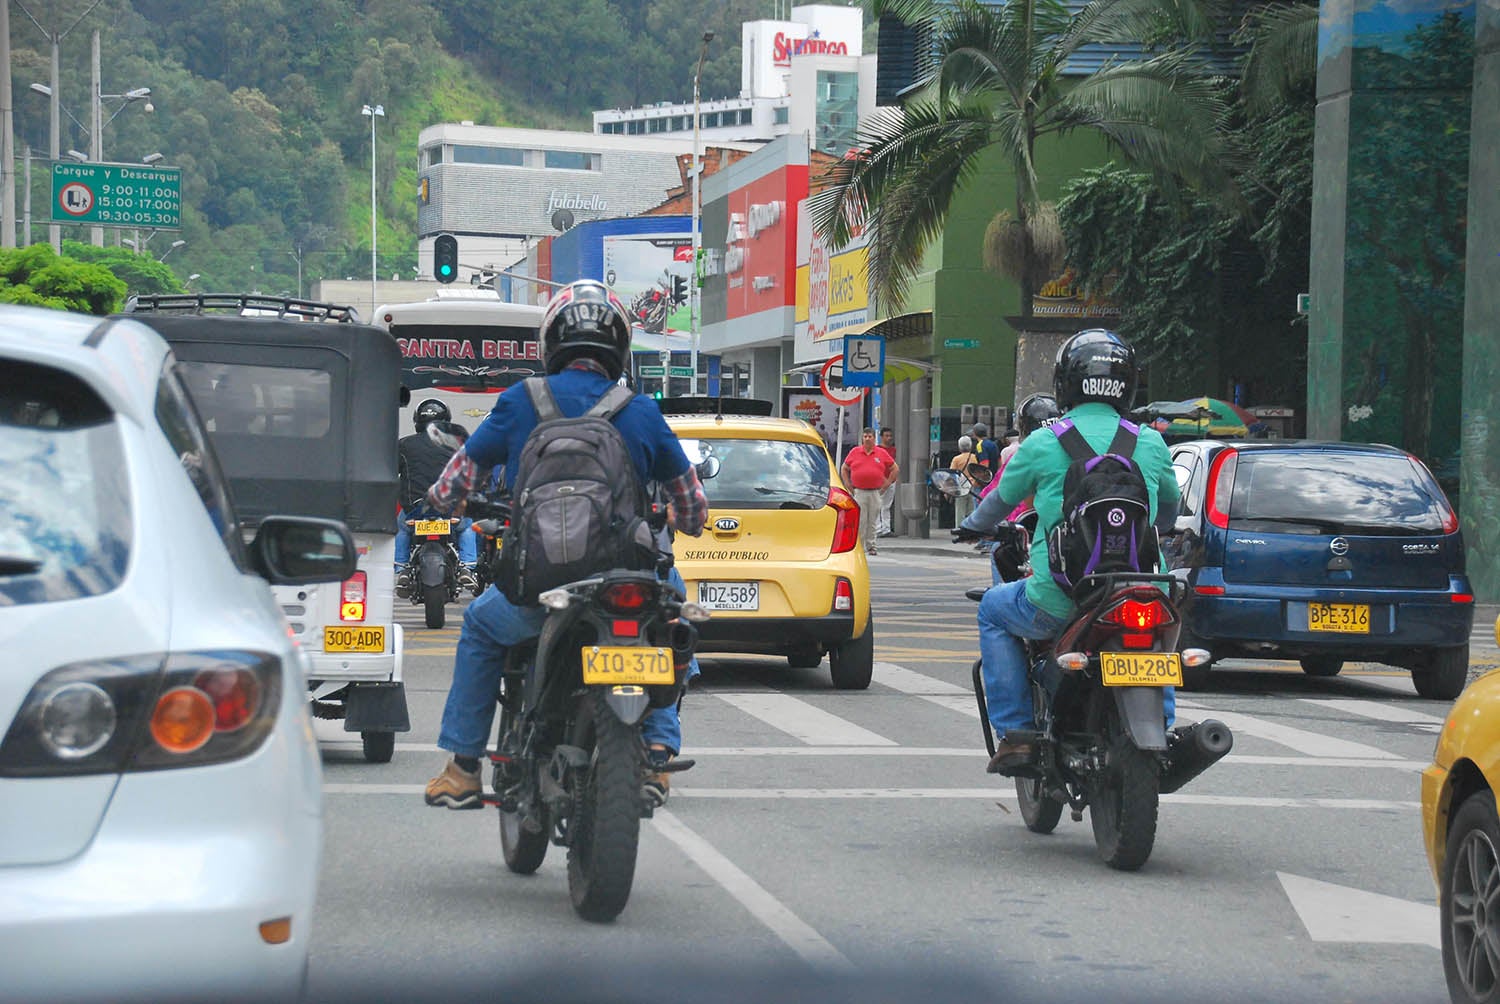
- Vulnerable road users are disproportionately affected. Between 2009 and 2021, motorcyclist, pedestrian, and cyclist deaths increased from 39% to 47%.
- While fatalities among occupants of motor vehicles with four or more wheels appear to have fallen, there continues to be an alarming rise in motorcyclist deaths (accounting for 27% of total deaths in 2021).
- Approximately 4,134,297 people in the Region of the Americas suffered non-fatal injuries in 2021. At least 638,620 of these injuries were serious.
Mortality from road traffic injuries
The Region of the Americas did not meet the target of the first Global Plan 2011-2020, which was to halve the number of deaths1 from road traffic injuries. This was also Target 6 of Sustainable Development Goal 3 (SDG 3)(1, 2). The World Health Organization (WHO) estimates that 145,090 people died as a result of road traffic crashes in 2021.2 This equates to a mortality rate of 14.09 per 100,000 inhabitants and represents 12% of all deaths worldwide (1.19 million deaths) (3). As Figure 1 shows, the number of deaths and mortality rate per 100,000 inhabitants have not significantly fallen since 2010.
Figure 1. Estimated number of deaths from road traffic injuries in the Region of the Americas, 2010-2021
Source: Prepared by the authors, based on United Nations Department of Economic and Social Affairs materials. World Population Prospects 2022. New York: United Nations; 2022 [Accessed 15 June 2023]; World Health Organization. Global status report on road safety 2023. Geneva: WHO; 2023.
According to the projected mortality trend (Figure 2), it will be difficult to meet the targets of the Global Plan 2021-2030 if its recommendations are not expedited (4).
Figure 2. Projected road traffic mortality rate in the Region of the Americas
Note: Age-standardized mortality rate per 100,000 inhabitants.
Source: Prepared by the authors, based on World Health Organization materials. Global Health Estimates. Data received personally from Bochen CAO on 3 July 2024.
Around 37% of deaths were in high-income countries, despite them having a higher percentage of the population (41%), registered motor vehicles (57%), and territory (49%). Low- to middle-income countries accounted for 7% of deaths, but occupy 3% of the territory, represent 5% of the regional population, and have 1% of registered motor vehicles (Figure 3).
Figure 3. Percentage of the population, estimated road traffic deaths, registered motor vehicles, and territory, by country income category, in the Region of the Americas, 2021Note: Income levels are based on 2021 World Bank classifications. No countries in the Region of the Americas fall into the low-income category.
Source: Prepared by the authors, based on United Nations Department of Economic and Social Affairs materials. World Population Prospects 2022. New York: United Nations; 2022; World Health Organization. Global status report on road safety 2023. Geneva: WHO; 2023; World Bank. World Bank Country and Lending Groups. Washington, D.C.: World Bank; 2022 [Accessed 15 June 2023]; International Road Federation. IRF World Road Statistics. Geneva: IRF; 2023 [Accessed 28 September 2023]; Country-reported information on registered motor vehicles in this report.
Figure 4 shows that road traffic mortality rates in high-income countries significantly increased from 11.23 (95% CI: 10.58-11.89) in 2010, to 12.97 (95% CI: 12.09-13.85) in 2021, while they remained stable in low- to middle-income countries, and decreased in high- to middle-income countries.
Figure 4. World Health Organization-estimated trend in road traffic mortality rates, by country income category, in the Region of the Americas, 2010-2021
Note: Income levels are based on 2021 World Bank classifications.
Source: Prepared by the authors, based on United Nations Department of Economic and Social Affairs materials. World Population Prospects 2022. New York: United Nations; 2022 [Accessed 15 June 2023]; World Health Organization. Global status report on road safety 2023. Geneva: WHO; 2023; World Bank. World Bank Country and Lending Groups. Washington, D.C.: World Bank; 2022 [Accessed 15 June 2023].
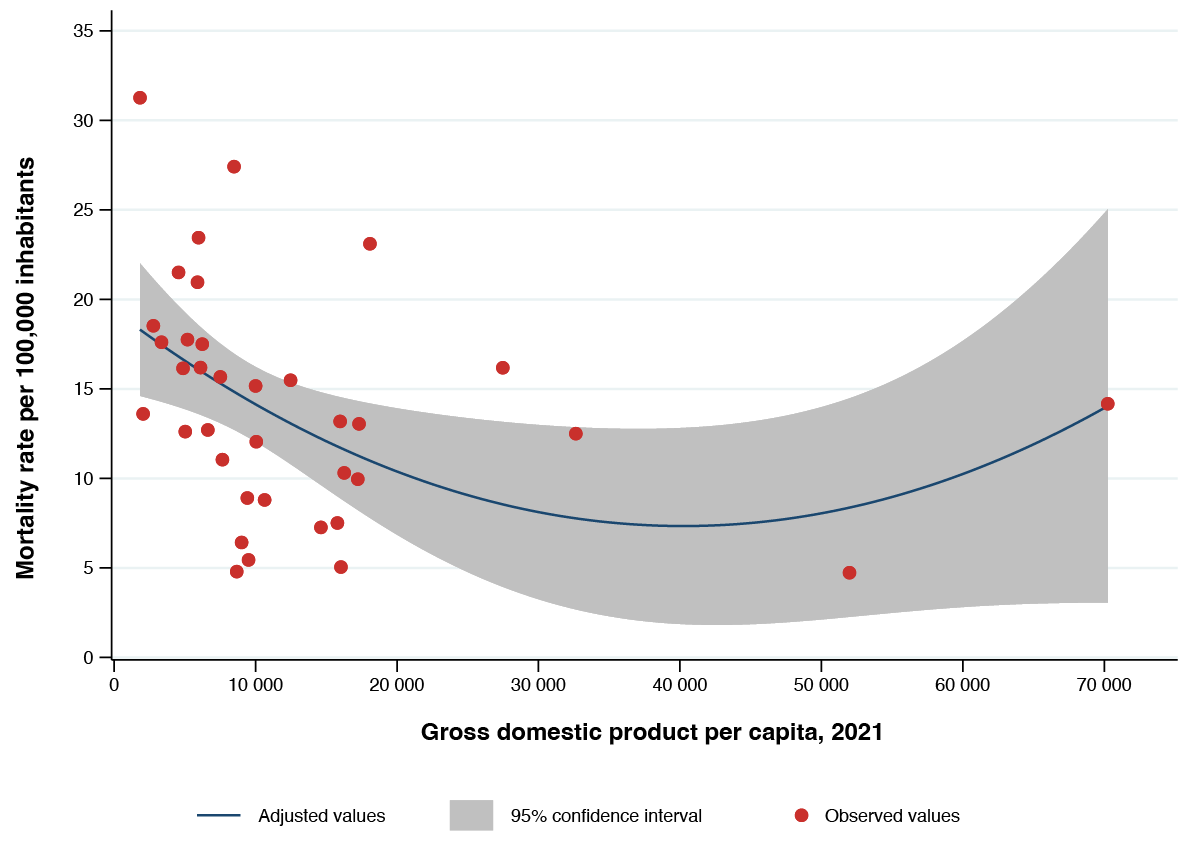
Figure 5 shows the relationship between gross domestic product per capita and mortality rate in 2021, in the countries of the Region. Although higher income tends to result in a lower mortality rate, several countries had a lower mortality rate than the United States, which has the highest per capita income in the Region. Countries with similar incomes also have vastly different mortality rates.
Figure 5. Relationship between estimated road traffic mortality rate and per capita gross domestic product, in the Region of the Americas, 2021
GDP: 15,781
Rate: 7.51
GDP: 10,636
Rate: 8.80
GDP: 27,478
Rate: 16.18
GDP: 17,226
Rate: 9.96
GDP: 6,228
Rate: 17.50
GDP: 3,345
Rate: 17.61
GDP: 7,507
Rate: 15.67
GDP: 51,988
Rate: 4.73
GDP: 16,265
Rate: 10.31
GDP: 6,104
Rate: 16.19
GDP: 12,472
Rate: 15.48
GDP: 9,500
Rate: 5.45
GDP: 7,653
Rate: 11.05
GDP: 8,477
Rate: 27.42
GDP: 5,965
Rate: 23.45
GDP: 4,551
Rate: 21.51
GDP: 9,011
Rate: 6.42
GDP: 5,026
Rate: 12.61
GDP: 9,999
Rate: 15.16
GDP: 1,830
Rate: 31.26
GDP: 2,772
Rate: 18.52
GDP: 5,184
Rate: 17.75
GDP: 10,046
Rate: 12.05
GDP: 2,046
Rate: 13.60
GDP: 14,618
Rate: 7.26
GDP: 5,892
Rate: 20.96
GDP: 6,622
Rate: 12.71
GDP: 32,641
Rate: 12.50
GDP: 18,083
Rate: 23.11
GDP: 9,414
Rate: 8.91
GDP: 8,666
Rate: 4.79
GDP: 4,869
Rate: 16.15
GDP: 16,033
Rate: 5.05
GDP: 70,249
Rate: 14.17
GDP: 17,313
Rate: 13.05
GDP: 15,976
Rate: 13.18
Note: Income levels are based on 2021 World Bank classifications.
Source: Prepared by the authors, based on United Nations Department of Economic and Social Affairs materials. World Population Prospects 2022. New York: United Nations; 2022 [Accessed 15 June 2023]; World Health Organization. Global status report on road safety 2023. Geneva: WHO; 2023; World Bank. World Bank Country and Lending Groups. Washington, D.C.: World Bank; 2022 [Accessed 15 June 2023].
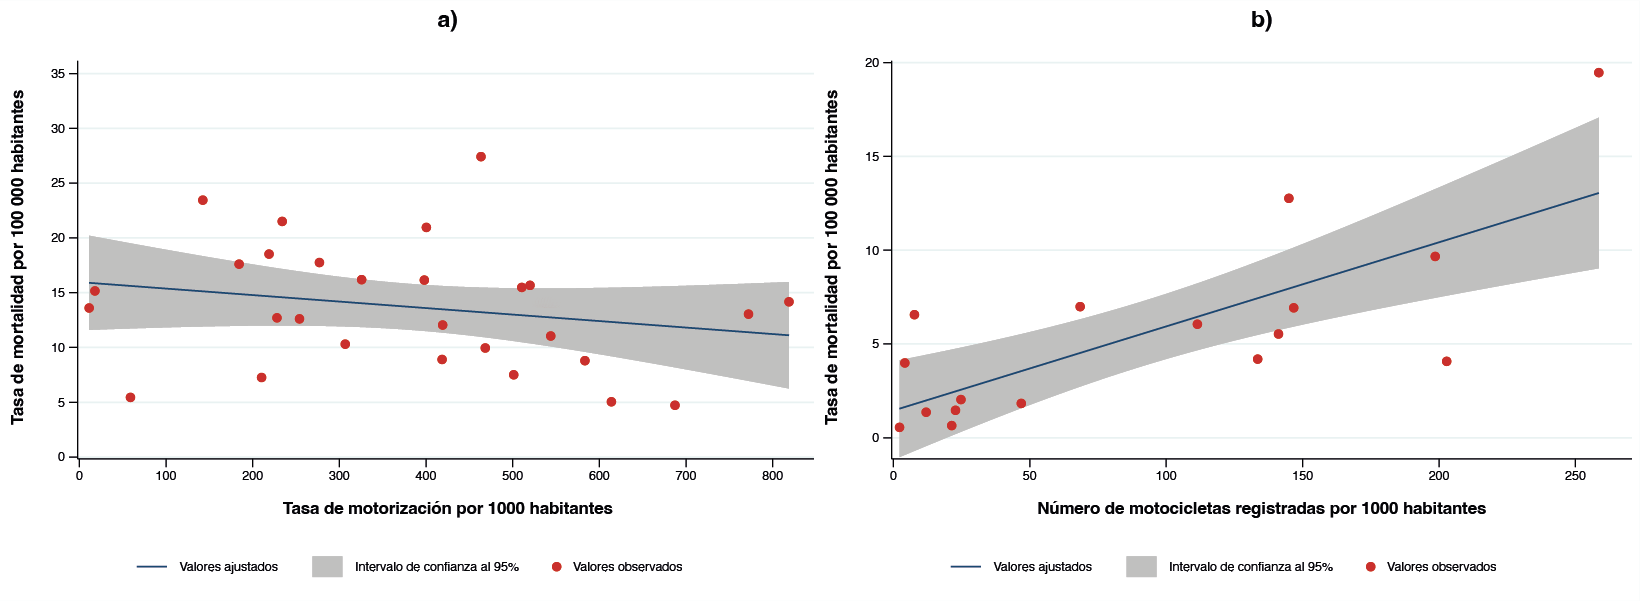
On first glance, there appears to be no relationship between motorization rate and road traffic injury mortality rate (Figure 6a). However, when analyzing the number of registered motorcycles and the mortality rate among their riders, the number of motorcyclist deaths increases significantly as the number of registered motorcycles per 1,000 inhabitants rises (Figure 6b). This highlights the importance of implementing proven prevention measures for motorcyclists and moving towards more sustainable and safer modes of transport that help improve the health of the population.
Figure 6. Relationship between estimated road traffic mortality rate and motorization rate, in the Region of the Americas, 2021
Motorization rate: 501
Mortality rate: 7.51
Motorization rate: 583
Mortality rate: 8.80
Motorization rate: 468
Mortality rate: 9.96
Motorization rate: 184
Mortality rate: 17.61
Motorization rate: 520
Mortality rate: 15.67
Motorization rate: 687
Mortality rate: 4.73
Motorization rate: 307
Mortality rate: 10.31
Motorization rate: 326
Mortality rate: 16.19
Motorization rate: 511
Mortality rate: 15.48
Motorization rate: 59
Mortality rate: 5.45
Motorization rate: 544
Mortality rate: 11.05
Motorization rate: 142
Mortality rate: 23.45
Motorization rate: 234
Mortality rate: 21.51
Motorization rate: 819
Mortality rate: 14.17
Motorization rate: 254
Mortality rate: 12.61
Motorization rate: 18
Mortality rate: 15.16
Motorization rate: 219
Mortality rate: 18.52
Motorization rate: 277
Mortality rate: 17.75
Motorization rate: 419
Mortality rate: 12.05
Motorization rate: 11
Mortality rate: 13.60
Motorization rate: 210
Mortality rate: 7.26
Motorization rate: 400
Mortality rate: 20.96
Motorization rate: 228
Mortality rate: 12.71
Motorization rate: 463
Mortality rate: 27.42
Motorization rate: 419
Mortality rate: 8.91
Motorization rate: 398
Mortality rate: 16.15
Motorization rate: 614
Mortality rate: 5.05
Motorization rate: 772
Mortality rate: 13.05
Mortality rate: 0.56
Number of motorcycles per 100,000 inhabitants: 2
Mortality rate: 3.99
Number of motorcycles per 100,000 inhabitants: 4
Mortality rate: 6.56
Number of motorcycles per 100,000 inhabitants: 8
Mortality rate: 1.36
Number of motorcycles per 100,000 inhabitants: 12
Mortality rate: 0.56
Number of motorcycles per 100,000 inhabitants: 21
Mortality rate: 1.46
Number of motorcycles per 100,000 inhabitants: 23
Mortality rate: 2.04
Number of motorcycles per 100,000 inhabitants: 25
Mortality rate: 1.83
Number of motorcycles per 100,000 inhabitants: 47
Mortality rate: 6.99
Number of motorcycles per 100,000 inhabitants: 68
Mortality rate: 6.05
Number of motorcycles per 100,000 inhabitants: 111
Mortality rate: 4.19
Number of motorcycles per 100,000 inhabitants: 134
Mortality rate: 5.33
Number of motorcycles per 100,000 inhabitants: 141
Mortality rate: 12.76
Number of motorcycles per 100,000 inhabitants: 145
Mortality rate: 6.93
Number of motorcycles per 100,000 inhabitants: 147
Mortality rate: 9.67
Number of
motorcycles per
100,000 inhabitants: 199
Mortality
rate: 4.07
Number of
motorcycles per
100,000 inhabitants: 203
Mortality
rate: 19.46
Number of
motorcycles per
100,000 inhabitants: 259
Deaths from road traffic injuries continue to be higher among vulnerable road users: 27% of individuals who died in the Region in 2021 were motorcyclists, 17% were pedestrians3, and 3% were cyclists (Figure 7). The proportion of deaths among these three types of vulnerable road user increased from 39% in 2009 to 47% in 2023, due to the rise in motorcyclist fatalities (Figure 8);4 this does not include deaths where the type of road user is unknown, which accounted for almost 10% in 2021 (Figure 7).
Figure 7. Percentage of estimated road traffic deaths, by type of road user and subregion, in the Region of the Americas, 2021
Note: Ecuador is not included.
Source: Prepared by the authors, based on World Health Organization materials. Global status report on road safety 2023. Geneva: WHO; 2023 [Accessed 1 May 2024].
Figure 8. Change in the percentage of recorded road traffic deaths, by type of road user and subregion, in the Region of the Americas, 2009-2023
Source: Prepared by the authors, based on World Health Organization materials. Global status report on road safety 2023. Geneva: WHO; 2023. Pan American Health Organization. Road Safety in the Americas. Washington, D.C.: PAHO; 2016; Pan American Health Organization. Report on Road Safety in the Region of the Americas. Washington, D.C.: PAHO; 2015; Pan American Health Organization. Report on Road Safety in the Region of the Americas. Washington, D.C.: PAHO; 2009.
As Figure 9 shows (panels a and b), road traffic deaths are more common in men (79%) and young adult populations aged 18 to 44 years (54%).
Figure 9. Reported percentage of deaths by sex, age group, and subregion of the Americas, 2021
Source: Prepared by the authors, based on World Health Organization materials. Global status report on road safety 2023. Geneva: WHO; 2023;.
The road users most affected differ across various age groups. Figure 10 shows information reported by 20 countries that provided this breakdown. It shows a higher percentage of pedestrian deaths among individuals under 15 and over 60 years old, but a higher relative proportion of motorcyclist deaths among younger populations.
Figure 10. Percentage of road traffic deaths, by type of road user and age group, in the Region of the Americas, 2021
It is important to note that aggregated data hide significant variations in the Region.5 A subregional mortality analysis6 shows that 34% of deaths in the Region were in North America, 29% in the Southern Cone, 16% in Mesoamerica and the Andean Region, 5% in the Latin Caribbean, and 1% in the non-Latin Caribbean (Figure 11). Figure 12 clearly shows that, while the mortality rate rose significantly in North America and the Latin Caribbean, it fell considerably in the Southern Cone, the Andean Region, and, to a lesser extent, in Mesoamerica.
Figure 11. Percentage of estimated road traffic deaths, by subregion of the Americas, 2021
Source: Prepared by the authors, based on World Health Organization materials. Global status report on road safety 2023. Geneva: WHO; 2023 [Accessed 1 May 2024].
Figure 12. Estimated road traffic mortality rate trend, by subregion of the Americas, 2010-2021
Source: Prepared by the authors, based on World Health Organization materials. Global status report on road safety 2023. Geneva: WHO; 2023.
WHO estimates showed that nine countries participating in this report managed to cut the number of road traffic deaths between 2010 and 2021.7 Deaths fell by 67% in Trinidad and Tobago, 33% in Cuba, 28% in Canada and Panama, 24% in Argentina, 23% in Brazil, and 22% in Uruguay. Chile and Mexico had a slightly smaller decrease (6% and 8%, respectively). The mortality rate per 100,000 inhabitants also fell in 13 participating countries. Trinidad and Tobago saw a 70% decrease, while it was between 30% and 49% in five countries (Argentina, Brazil, Canada, Cuba, and Panama), between 10% and 29% in three countries (Chile, Mexico, and Uruguay), and between 5% and 9% in four more countries (Bolivia [Plurinational State of], Guatemala, Paraguay, and Saint Lucia). Figure 13 analyzes this progress by region, subregion, and income level.
Figure 13. Number of countries in the Region of the Americas with changes in road traffic mortality, 2010-2021
Note: For the purposes of this report, 2010 is compared with 2021 to analyze the progress of the Decade of Action for Road Safety 2011-2020. This is to minimize the impact of the pandemic, which was still ongoing in 2020. This analysis does not include the British Virgin Islands, as no WHO mortality estimates were provided for either year. One country (Saint Lucia) had the same number of deaths. A difference of less than 5% was observed In six countries (Costa Rica, Ecuador, Guyana, Nicaragua, Peru, and Suriname).
Source: Prepared by the authors, based on World Health Organization materials. Global status report on road safety 2023. Geneva: WHO; 2023; World Bank. World Bank Country and Lending Groups. Washington, D.C.: World Bank; 2022 [Accessed 15 June 2023].
Trinidad and Tobago stands out in the Region for having achieved the target of the Global Plan 2011-2020, having consistently reduced the number of deaths and mortality rate during this period (Figure 14). Box 1 presents some of the key actions taken in Trinidad and Tobago to achieve this significant milestone.
Figure 14. Trinidad and Tobago’s road traffic mortality trend, 2010-2021
Box 1. Improving road safety: Trinidad and Tobago’s experience
Over the last decade, the Ministry of Works and Transport has dedicated significant effort to traffic management and road safety. In line with global initiatives, Trinidad and Tobago committed to both the First Decade of Action for Road Safety (2011-2020) and the subsequent Second Decade (2021-2030), using a safe systems approach to try and halve road traffic deaths and injuries.
The country’s efforts have led to remarkable progress, highlighted by the drop in mortality rates recorded by the national police service: 110 deaths in 2018, 102 in 2019, 88 in 2020, and 69 in 2021. These figures highlight the success of strategic interventions, legislative reforms, and a strong commitment to action. This has led Trinidad and Tobago to become the first country in the Region to meet the target of reducing road traffic deaths by 50%.
Summary of initiatives:
Pillar 1. Road safety management:
- Rebuilding the National Road Safety Council to coordinate multisectoral efforts, establish quantitative targets, and finalize a national road safety plan for 2020-2030.
- Continuously developing a comprehensive national transport master plan, to synchronize the transport system.
Pillar 2. Safer roads and mobility:
- Investing approximately US$ 40 million in road infrastructure projects, such as pedestrian bridges, crosswalks, traffic lights, police barriers, and barrier systems.
- Implementing road markings, road rehabilitation, and other measures to improve road safety.
Pillar 3. Safe vehicles:
- Introducing regulations to improve the quality of imported vehicles, establishing vehicle testing centers, and implementing an electronic vehicle inspection system for greater transparency and accountability.
Pillar 4. Safer road users:
- Legislative reforms aimed at reducing speed, ensuring the safety of pedestrians and cyclists, and rehabilitating drivers, including regulations on seat belt use, child restraint systems, breathalyzers, speed measuring devices, safety helmets, penalty points, and fixed penalty systems.
- Introducing windshield and window tinting regulations to ensure compliance with safety standards.
Pillar 5. Post-crash response:
- Conducting an Emergency and Critical Care Systems Assessment (ECCSA).
This summary outlines Trinidad and Tobago’s comprehensive approach to road safety and reflects a decade of concerted efforts to create safer roads, vehicles, and behaviors.
For more information on Trinidad and Tobago, please watch the following video:
Source: Prepared by the authors, based on Ministry of Works and Transport of Trinidad and Tobago materials. Road Safety: Initiatives Overview 2011-2020 [brochure]. Port of Spain: Ministry of Works and Transport; 2021; Ministry of Health of Trinidad and Tobago. Emergency Care System Assessment and Consensus-Based Action Priorities: Trinidad and Tobago [internal document]. Port of Spain: Ministry of Health; 2019
These countries’ progress contrasts with a significantly larger rise in both the number of deaths (21%) and mortality rate (12%). Between 2010 and 2021, the number of deaths rose by 63% in Haiti, 56% in Belize, and 53% in Jamaica. Meanwhile, they increased by between 30% and 49% in the Bahamas, Colombia, the Dominican Republic, Honduras, and the United States. The number of deaths rose by between 10% and 29% in Barbados, Bolivia (Plurinational State of), Costa Rica, Ecuador, El Salvador, Guatemala, Nicaragua, Paraguay, Peru, and Suriname. In Guyana, it rose by 5% to 9%.
Figure 15 shows the estimated mortality rate in the different participating countries in 2021. The analysis reveals significant variations in the extent (number of deaths in the country) and the risk of dying from this cause (mortality rate per 100,000 inhabitants). By way of example, the difference between Haiti’s mortality rate and the estimated average in the Region is twofold, and it is almost sevenfold when compared to the estimated rate for Canada. However, the significant number of deaths in Brazil, Colombia, the United States, and Mexico must be reduced to achieve the regional target of the Global Plan 2021-2030. These four countries account for 72% of all deaths in the Region.
Figure 15. Number of road traffic deaths and mortality rate (per 100,000 inhabitants), estimated by country, Region of the Americas, 2021
Source: Prepared by the authors, based on United Nations Department of Economic and Social Affairs materials. World Population Prospects 2022. New York: United Nations; 2022 [Accessed 15 June 2023]; at World Health Organization. Global status report on road safety 2023. Geneva: WHO; 2023 [Accessed 1 May 2024].
It is essential that deaths be properly registered, and regional death registries still have much room for improvement. One issue is the difference between country-reported data and WHO mortality estimates. Differences are primarily due to the data sources and definitions used. WHO estimates are based on civil registration data and vital statistics that combine data from multiple sources. They include road traffic deaths in a given year, regardless of the amount of time between the road traffic crash and death. Many countries report data from a single source and only include deaths that occur at the scene or within a limited time frame therefrom. The WHO adjustment also involves proportionally redistributing deaths classified under non-specific codes (3,5).
Figure 16 shows that, since the previous report, this underestimation has improved in Argentina (from 4% to 3%), Mexico (from 5% to 4%), Canada (from 5% to 3%), the United States (from 17% to 11%), Honduras (from 22% to 9%), Chile (from 23% to 19%), Costa Rica (from 29% to 11%), Cuba (from 34% to 4%), Peru (from 50% to 41%), and Barbados (from 78% to 75%). However, underestimation worsened in Brazil (from 0% to 7%), Guyana (from 5% to 23%), Saint Lucia (from 7% to 14%), Colombia (from 9% to 15%), Panama (from 20% to 30%), Bolivia (Plurinational State of) (from 52% to 61%), and Ecuador (from -2% to 96%). It remained unchanged in Dominica, Belize, Antigua and Barbuda, El Salvador, Paraguay, Suriname, the Dominican Republic, Trinidad and Tobago, Uruguay, Guatemala, and Jamaica.
Figure 16 Percentage difference between the number of country-reported deaths in the Region of the Americas and World Health Organization estimates: a comparison between 2016 and 2021
Source: Prepared by the authors, based on World Health Organization materials. Global status report on road safety 2023. Geneva: WHO; 2023 [Accessed 1 May 2024].
An analysis of the information sources used to compile mortality data shows that, in 18 of the participating countries, mortality data comes exclusively from police records. These records are known to significantly underestimate the number of deaths (6). The Pan American Health Organization (PAHO) has highlighted the need for process mapping using multiple sources to compile and systematize vital statistics information (5). This would not only consolidate the major role of regional road safety observatories —particularly those involved in the Ibero-American Road Safety Program, developed by the Ibero-American Road Safety Observatory— but would provide quality and comparable mortality statistics, to better understand and study the causes of death with a view to improving public health.
Improving vital statistics has numerous benefits. In particular, it allows better quantification of deaths attributable to road safety. In turn, problems can be pinpointed and the impact of actions taken to promote healthier, safer, and more sustainable mobility assessed. Box 2 presents work carried out in the Dominican Republic, with PAHO technical support.
Box 2. Improving death registration through specific technical cooperation between the Pan American Health Organization and the Dominican Republic authorities.
In the 2013 second global status report on road safety, the Dominican Republic had the second highest road traffic mortality rate in the world—41.7 deaths per 100,000 inhabitants.a This triggered the Director of the Pan American Health Organization (PAHO), Dr. Carissa Etienne, to visit the President of the Republic and prioritize technical cooperation in road safety. This largely focused on improving death registration, and a national expert on the matter was appointed to the country’s PAHO Representative Office.
Process summary
- PAHO is providing technical cooperation to develop a pilot project that will replicate the experience of Brazil’s Life in Traffic Project, using the free Reclink III (probabilistic record linkage) software.
- Three pilot projects are being developed, and the Permanent Road Safety Observatory (OPSEVI) methodology has been adopted.
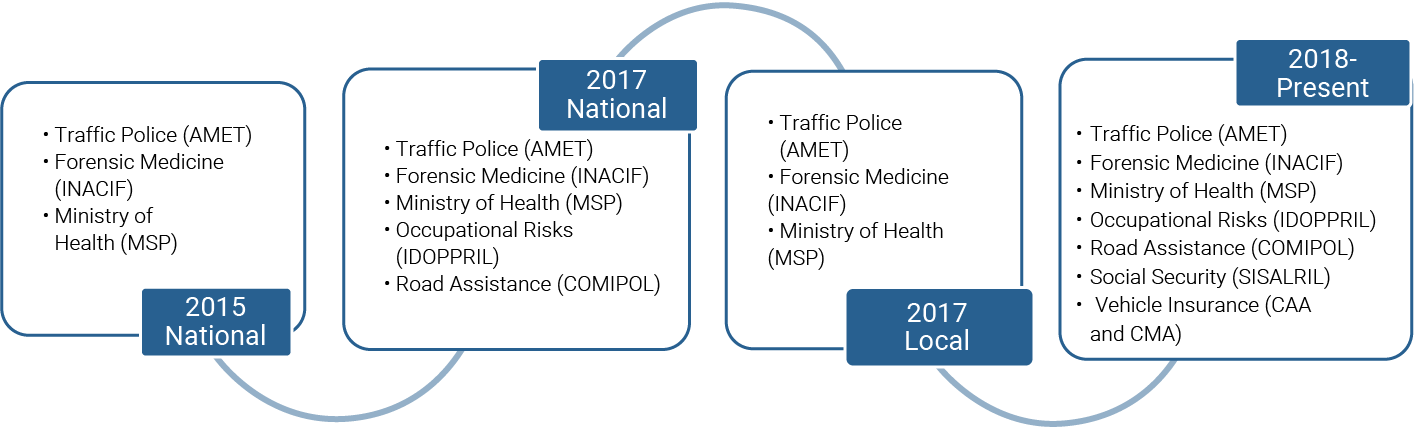
- The road safety area and PAHO Evidence and Intelligence for Action in Health Department have jointly implemented an exercise to validate OPSEVI’s work in recent years. This work will continue until it serves as the basis for consolidating the country’s road statistics (Figure R2.1).
Figure R2.1. Permanent Road Safety Observatory Projects
Results
- Building trust in the methodology, demonstrating that it is useful for both the country and each of the institutions involved. This should be done at a minimal cost and be adaptable to weaknesses in existing records. PAHO’s neutrality and reliability was key during this initial process of coordinating stakeholders.
- Combining data from forensic medicine and the mortality system captured a significant number of deaths that occurred once injured individuals had arrived at a health center, representing approximately 38% of total annual deaths.
- Comparing death and injury databases identified a significant number of deaths after 30 days that were incorrectly recorded in the country’s mortality system (about 10%).
- Data generators confirmed underreporting levels and identified where and in which variables their greatest weaknesses lie, enabling improvements in these areas.
- National data contributes to local data and vice versa.
Conclusions
OPSEVI is currently recognized as providing the most accurate national death toll. The process has helped to improve other institutions and has been crucial in officially compiling the country’s vital statistics in the short term. There is currently a National Roadmap to achieve this goal. Although many challenges remain, the figure below shows the significant improvement in quality of the Dominican Republic’s road traffic mortality data. In less than 10 years, the potential underestimation between the country-reported value and the World Health Organization estimate has decreased from 118% to just 2.7% (Figure R2.2).
Figure R2.2. Road traffic deaths in the Dominican Republic, 2013-2023
Source: Prepared by the authors, based on road safety reports provided by Rosa Urania Abreu from the Dominican Republic Office.
World Health Organization. Global status report on road safety 2013. Geneva: WHO; 2013.
World Health Organization. Global status report on road safety 2015. Geneva: WHO; 2015.
World Health Organization. Global status report on road safety 2018. Geneva: WHO; 2018. World Health Organization. Global status report on road safety 2023. Geneva: WHO; 2023;
At the time of writing this report, one territory (the British Virgin Islands) continues to define road traffic death as death that occurs at the scene of the crash. Two countries (Guatemala and Haiti) define it as death within the first 24 hours. One country (Chile) defines it as death within 48 hours, and another (Santa Lucia) as within the first seven days. Meanwhile, 14 countries8 compile records of deaths occurring within 30 days of a road traffic crash. Although an adjustment factor can be used, defining road traffic deaths in this way may underestimate the total number of deaths (7). A better approach, therefore, is to implement high-quality civil registration and vital statistics systems that include deaths within an unlimited period of time. For this, the WHO and PAHO ICD-10 and ICD-11 classification systems should be used (5).
Finally, the recording of key variables for mortality analysis must be improved. One country in this report (Belize) did not provide a breakdown by sex. Four countries (the Bahamas, Belize, Nicaragua, and Panama) did not provide a breakdown by age group. Eight countries9 did not document the type of road user, and in four countries (the Bahamas, Jamaica, Mexico, and Suriname), where this data was documented, the affected road user was not known in over 30% of cases. Finally, 12 countries10 had no data on type of road user by age group. This is the minimum information required to implement locally adapted prevention strategies.
However, other important data, not explored in this report, are also needed and have huge potential to guide decision-making. These include georeferencing road traffic crashes (or deaths) and exposure to risk factors of interest (type and characteristics of vehicles involved, road characteristics, use of alcohol and other drugs, use of safety systems, etc.).
Non-fatal road traffic injuries
Road traffic injuries not only lead to death. An even greater number of people suffer non-fatal injuries, many of which are serious and have permanent after-effects. Although it is important to calculate the public health burden of these injuries, only 28 countries participating in this report reported the total number of people injured, and 16 reported the number of people seriously injured. The exact coverage of this data is unknown, and it must be documented in each country. It is also clear that some countries may be significantly underestimating the extent of this indicator. Bolivia (Plurinational State of) may be one such example. It reported only 11 injured individuals in 2021, equating to a rate of 0.09 per 100,000 inhabitants (Figure 17).
Figure 17. Rate of non-fatal road traffic injuries per 100,000 inhabitants, by country, Region of the Americas, 2021
Note: Data on the total number of injured individuals (a) and the number of seriously injured individuals (b) was the same in Bolivia (Plurinational State of), Brazil, Guyana, and Panama.
Source: Prepared by the authors, based on United Nations Department of Economic and Social Affairs materials. World Population Prospects 2022. New York: United Nations; 2022 [Accessed 15 June 2023]; World Health Organization. Global status report on road safety 2023. Geneva: WHO; 2023 [Accessed 1 May 2024].
This information shows that, for each fatality, there are, on average, 28 individuals with non-fatal injuries and 4.4 individuals with serious injuries (although the same number was reported for both indicators in Bolivia [Plurinational State of], Brazil, Guyana, and Panama). Based on the averages reported in these countries, an estimated 4,134,297 injuries and at least 638,620 serious injuries may have occurred in the Region of the Americas in 2021.
Excluding data from Bolivia (Plurinational State of), the variation observed among countries reporting these indicators ranged from a total of 86 people with non-fatal injuries for each fatality in Colombia, to 1.6 in Honduras. Meanwhile, 21 serious injuries were recorded for every death in Panama, compared to 0.6 in El Salvador (Figure 18).
Figure 18. Number of people suffering non-fatal road traffic injuries (any injury and serious injuries) per estimated death, by country, Region of the Americas, 2021
Note: Data on the total number of injured individuals (a) and the number of seriously injured individuals (b) was the same in Bolivia (Plurinational State of), Brazil, Guyana, and Panama.
Source: Prepared by the authors, based on World Health Organization materials. Global status report on road safety 2023. Geneva: WHO; 2023 [Accessed 1 May 2024].
In 15 of the 19 countries that reported having a system for documenting serious injuries, this definition includes or refers to hospital admission. In seven countries (Brazil, Chile, Colombia, Haiti, Nicaragua, Paraguay, and Suriname) it includes time off work (normally three days, but over 30 days in Chile). In El Salvador, it includes people treated in hospital emergency units for six hours or more. In Colombia, it includes individuals suffering some kind of disability directly related to the road traffic injury. In Uruguay, the medical professional attending the scene determines the injury’s severity. Antigua and
Barbuda was the only country using a standardized injury severity score to define serious injuries.
These data highlight the need to standardize the Region’s operational definition of serious injuries to improve documentation and facilitate country comparison and analysis.There is less information to calculate (or at least estimate) the percentage of injured individuals suffering permanent damage or disabilities due to road traffic crashes (Figure 19). Only four countries reported this indicator. The percentage ranged from 1.9% in Costa Rica to 90% in the British Virgin Islands, which recorded only one death in 2021. This would mean around 1.4 people suffered road traffic injury-related disabilities annually for each fatality in Costa Rica, Mexico, and Uruguay (24,716 in total). While individuals in other countries in the Region inevitably suffer disabilities due to road traffic injuries, the extent of this indicator is still not systematically documented with quality information enabling international comparison.
Figure 19. Percentage of people with road traffic injuries who suffer permanent disability (and estimated number of new disabilities), by country, Region of the Americas, 2021
Note: The British Virgin Islands provided an estimated percentage of injured individuals who suffered disability (90), but did not report the total number of people suffering road traffic injuries.
Road traffic crashes
In 2021, in the 29 countries providing information, 3.1 million road traffic crashes resulted in injury.11 This equates to an average rate of 314 per 100,000 inhabitants, or 560 per 100,000 registered motor vehicles.12 Figure 20 shows both rates by country and a significant variation across countries in the Region.
Figure 20. Rate of road traffic crashes resulting in injury, per 100,000 inhabitants and per 100,000 registered vehicles, by country, Region of the Americas, 2021
Note: Road traffic data for Argentina and the United States is from 2020. Saint Lucia’s data is from 2019. The remaining data is from 2021. The Bahamas, Haiti, and Suriname did not report this information. The most recent reported data (from 2021) on registered motor vehicles has been used. This excludes Panama and the United States, whose data is from 2020, and Guyana, whose data is from 2014. The Bahamas, Belize, and Haiti did not report this information. Despite registering 1,325 deaths, Bolivia (Plurinational State of) reported only seven road traffic crashes in 2021. While Panama reported 24 road traffic crashes in the same year, its National Institute of Statistics and Census documented 12,230 crashes resulting in injury. Mexico’s data does not include federal highways. Road traffic crash data from Jamaica, received from local authorities after the data collection deadline for this report, has been included.
Source: Prepared by the authors, based on United Nations Department of Economic and Social Affairs materials. World Population Prospects 2022. New York: United Nations; 2022 [Accessed 15 June 2023].
The high number of road traffic crashes reported may still be an underestimate, given that some countries did not participate or provide this information, and local statistics may not record all events. For example, the figure may be higher in Bolivia (where 1,325 deaths but only seven road traffic crashes were registered), in Panama (where only 24 road traffic crashes were reported, but 243 deaths and 6,728 non-fatal injuries occurred), and in Mexico (which did not include the number of traffic crashes on federal highways resulting in injury).
Standardizing the definition of road traffic crashes resulting in injury would allow for better data comparison between countries. Each country uses its own exact definition. Honduras even reported having no definition, and Dominica and Suriname said that they did not use a standard definition. Some countries explicitly include road traffic crashes involving at least one fatality.13 Three other countries exclude crashes involving fatalities (Antigua and Barbuda, Argentina, and Panama). Some countries’ definition14 may also include crashes in which only property is damaged.
Some countries distinguish between minor and serious injuries. In Barbados, serious injuries are defined as those requiring hospitalization; in Antigua and Barbuda, they involve the airway, breathing, or circulation; and in the United States, they meet other criteria.15 Other countries, such as Ecuador and Guatemala, acknowledge that severity may vary. Road traffic crashes resulting in injury tend to be defined as those in which at least one person is injured.16 However, more subtle differences can be seen in country-specific definitions. Colombia’s definition, for example, includes suicides or attempted suicides that injure other road users. In Guatemala, all suicides are excluded. In Chile, emphasis is placed on the unintentional or involuntary nature of the crash. In Nicaragua, they are regarded as culpable actions (reckless or negligent omissions that give rise to liability).
The information sources also vary. In 18 countries17 , this data was taken from police crash reports. In others (Argentina, Brazil, Canada, and Uruguay), it came from the coordinating body, and, in Ecuador, from transport statistics. In Colombia, Costa Rica, and Saint Lucia, the data was provided by public or private insurance companies. In Paraguay and the Dominican Republic, information was also collected from emergency calls reporting a victim. Mexico, Panama, and Suriname’s National Institutes of Statistics compile this information. In most countries, the statistics reflect all national records; however, in the United States, data is estimated using a nationally representative sample (Crash Report Sampling System).
As a result, the statistics presented in this report could be affected by some of the issues limiting country comparison.
To better understand the maturity of countries’ data systems, additional information not contained in this report is needed. This includes key variables for decision-making, such as georeferencing crashes, road conditions, vehicle conditions, exposure to risky behaviors (alcohol, drugs, speed, etc.), and use of safety systems (seat belt, child restraint system, helmet). The United Nations Road Safety Fund recently provided funding to the PAHO Representative Office in Brazil, to help local authorities compile information to prevent crashes (Box 3).
Box 3. Improving the prevention of road traffic crashes on Brazil’s federal highways using an improved road data system
To improve road safety and prevent injuries and deaths on Brazilian roads, the Federal Highway Police (PRF), National Department of Transport Infrastructure (DNIT), National Traffic Secretariat (SENATRAN), and University of Brasilia’s Postgraduate Program in Transport have launched an initiative aimed at streamlining data collection and management processes to define effective countermeasures for the country’s road infrastructure.
This initiative will include developing a digital system to collect, process, and analyze pre-crash data on risk factors identified on critical sections of road under the jurisdiction of the PRF. To facilitate this task, an app will be created for police officers to use during investigations.
The initiative aims to support effective countermeasures to prevent injuries and deaths on Brazil’s federal highways. An interoperable system to collect and analyze road data will be developed, and professional training will be provided. Efforts will also be made to effectively implement these countermeasures through the Brazilian road authorities responsible for infrastructure and law enforcement.
The PRF and DNIT are the federal agencies responsible for enforcing highway traffic laws, as well as highway construction, maintenance, and expansion. They are also responsible for collecting statistical data and conducting studies on road traffic crashes and their causes.
The University of Brasilia supports these organizations through projects that include developing methodologies and reviewing and improving technical documents. It also participates in training on interventions, as well as the evaluation and monitoring thereof. SENATRAN is committed to ensuring that these methods comply with Brazilian standards, policies, and national plan for the Global Plan 2021-2030.
Source: Prepared by the authors, based on Pan American Health Organization materials. PAHO, PRF, DNIT, SENATRAN and UnB launch project to improve road data systems and prevent traffic injuries and deaths in Brazil. Washington, D.C.: PAHO; 2024. United Nations Road Safety Fund. Info Session: Improving Road Data System in Brazil. Washington, D.C.: UNRSF; 2023.
Registered motor vehicles
Based on information received from 29 of the 32 participating countries,18 the Region has an estimated motorization rate of 561.7 per 1,000 inhabitants.19 Analyzing regional trends, Figure 21 shows an increase of 22.88% in the total number of registered vehicles between 2012 and 2020 (14.04% in the rate of total registered vehicles per 1,000 inhabitants). This increase is even greater in the case of motorcycles: they increased by 61.98% between 2012 and 2020 (50.32% if the number of registered motorcycles per 1,000 inhabitants is considered). The estimated rate of motorcycles per 1,000 inhabitants was 81.17 per 1,000 inhabitants in 2021.20
Figure 21. Motorization rate trend reported in the Region of the Americas
Note: Of the 32 participating countries, information from the Bahamas, Belize, and Haiti is not included as they did not have this data. To estimate total motorization rate, the denominator included the population of the 29 countries that provided data for at least one year. Similarly, to estimate the rate of motorcyclists per 1,000 inhabitants, the denominator included the population of the 24 countries that provided data for at least one year. It is worth noting that not all countries provided information for both indicators or for all years (e.g., Barbados only reported data for 2021, and the United States had no data for that year). The figures presented in Annex 2 show the information received from each country. Data on registered motor vehicles in Suriname is from October 2020. According to information received in the survey, the number of registered motor vehicles in Panama fell between 2019 and 2020, but this data could not be confirmed with the country’s authorities.
Source: Prepared by the authors, based on United Nations Department of Economic and Social Affairs materials. World Population Prospects 2022. New York: United Nations; 2022.
An inverse correlation is observed when comparing motorization rate and mortality rate per registered vehicle: the higher the motorization, the lower the mortality rate per registered vehicle (Figure 22). However, it is important to consider that countries have no way of measuring the actual level of total vehicle registration coverage. This could be why the estimated mortality rate per registered vehicle is much higher in Nicaragua and Guyana than in other countries. The relationship between motorcycle rate per 1,000 inhabitants and number of registered motorcycle deaths is not as clear (Figure 23).
Figure 22. Comparison of motorization rate per 1,000 inhabitants and mortality rate per 100,000 registered motor vehicles, by country, Region of the Americas, 2021
Note: Of the 32 participating countries, information from the Bahamas, Belize, and Haiti is not included as they did not have this data. The most recent available data on registered motor vehicles in Panama and the United States, included in this figure, is from 2020; Guyana’s data is from 2014.
Source: Prepared by the authors, based on United Nations Department of Economic and Social Affairs materials. World Population Prospects 2022. New York: United Nations; 2022 [Accessed 15 June 2023]; World Health Organization. Global status report on road safety 2023. Geneva: WHO; 2023 [Accessed 1 May 2024].
Figure 23. Comparison of registered motorcycle rate per 1,000 inhabitants and motorcyclist mortality rate per 100,000 registered motorcycles, by country, Region of the Americas, 2021
Source: Prepared by the authors, based on United Nations Department of Economic and Social Affairs materials. World Population Prospects 2022. New York: United Nations; 2022 [Accessed 15 June 2023]; World Health Organization. Global status report on road safety 2023. Geneva: WHO; 2023 [Accessed 1 May 2024].
Conclusions
- Road traffic injuries remain a priority public health problem due to the high number of deaths and serious injuries caused.
- The drop in mortality rate in several countries in the Region is overshadowed by significant increases in others, preventing the Region from reaching the target of the Global Plan 2011-2020.
- Seemingly fewer fatalities among occupants of vehicles with four or more wheels are offset by the increase in motorcyclist deaths.
- Further consolidation of quality data systems and standardized data collection methodologies facilitating international comparison is needed.
- The evidence generated by these reports helps identify priority areas for local, subregional, and regional intervention to implement a safe systems approach to road traffic and move towards more sustainable, safer, and healthy mobility.
- The statistics presented in this report could be affected by some of the issues limiting country comparison.
- Working with the Ibero-American Road Safety Observatory and other regional or national observatories to standardize definitions relevant to road safety (deaths, serious injuries, disabilities, road traffic crashes resulting in injury, etc.) is one way to improve statistical information.
Footnotes
1 Injury or trauma is the physical or physiological damage resulting from the body’s exposure to a force or energy (mechanical, thermal, electrical, chemical, radiant, or extreme pressure) at an amount or transfer rate that exceeds physiological tolerance. This also includes damage caused by the lack of a vital element, such as oxygen or heat. World Health Organization. ICD-11 for Mortality and Morbidity Statistics. Geneva: WHO; 2022. Available from: https://icd.who.int/browse/2024-01/mms/en.
2 In this publication, the term “road traffic crash” is used to encompass crashes (impact between a vehicle and an object, which is usually stationary) and collision (impact between two or more vehicles of all types, which are usually moving). These occur on public roads and involve at least one moving vehicle (including rollovers and run overs producing pedestrian injuries), causing injuries of varying severity. The term “road traffic crash” also includes injuries attributed to road traffic that, although not caused by a crash or collision, have significant public health and road safety implications (e.g., whiplash injuries caused by sudden braking). These are generally considered road traffic crashes or incidents. The terms “accident” and “traffic accident” are omitted throughout due to their connotation of a random, inexplicable, or unpredictable event that, therefore, cannot be prevented.
3 Although the report includes information on electric scooter user deaths for the first time, for the purposes of this report, they were added to the pedestrian category, as they do not represent a significant number or percentage for the Region, based on ICD-11 criteria: World Health Organization. ICD-11 for Mortality and Morbidity Statistics. Geneva: WHO; 2020.
4 It is important to note, however, that the same countries did not participate in all reports. For further details, please review the previous reports: Pan American Health Organization. Status of Road Safety in the Region of the Americas. Washington, D.C.: PAHO; 2019 [updated to 2020]; Pan American Health Organization. Road Safety in the Americas. Washington, D.C.: PAHO; 2016; Pan American Health Organization. Report on Road Safety in the Region of the Americas. Washington, D.C.: PAHO; 2015; Pan American Health Organization. Report on Road Safety in the Region of the Americas. Washington, D.C.: PAHO; 2009.
5 The PAHO working document Road traffic mortality and socio-economic inequalities in the Americas (unpublished) shows significant inequalities between countries in this regard. This highlights the importance of carrying out future studies to further investigate inequalities in this and other indicators.
6 North America: Canada and the United States; Latin Caribbean: Cuba, Haiti, the Dominican Republic, and Puerto Rico; Non-Latin Caribbean: Antigua and Barbuda, the Bahamas, Barbados, the British Virgin Islands, Dominica, Grenada, Guyana, Jamaica, Saint Kitts and Nevis, Saint Lucia, Saint Vincent and the Grenadines, Suriname, and Trinidad and Tobago; Southern Cone: Argentina, Brazil, Chile, Paraguay, and Uruguay; Mesoamerica: Belize, Costa Rica, El Salvador, Guatemala, Honduras, Mexico, Nicaragua, and Panama; and Andean Region: Bolivia (Plurinational State of), Colombia, Ecuador, Peru, and Venezuela (Bolivarian Republic of).
7 In this report, 2010 is compared with 2021 to minimize the effect of the ongoing pandemic in 2020. World Health Organization. Global status report on road safety 2023. Geneva: WHO; 2023.
8 Argentina, the Bahamas, Brazil, Canada, Colombia, Cuba, the Dominican Republic, Jamaica, Nicaragua, Panama, Peru, Suriname, the United States, and Uruguay.
9 Barbados, Belize, Bolivia (Plurinational State of), Ecuador, Haiti, Nicaragua, Panama, and Saint Lucia.
10 The Bahamas, Belize, Bolivia (Plurinational State of), Dominica, Ecuador, Guatemala, Haiti, Honduras, Nicaragua, Panama, Saint Lucia, and Suriname.
11 The Bahamas, Haiti, and Suriname reported having no available road traffic crashes data for recent years.
12 Belize’s data was not included in this last indicator, as it did not report the number of registered motor vehicles.
13 Barbados, Belize, Canada, Chile, Costa Rica, Cuba, Ecuador, Guatemala, Mexico, Nicaragua, and the United States.
14 Barbados, Bolivia (Plurinational State of), Brazil, Chile, Colombia, Costa Rica, Cuba, El Salvador, Guatemala, Guyana, Nicaragua, Panama, Peru, Trinidad and Tobago, and the United States. El Salvador defines them as any road traffic crashes that occur on public roads (originating in, ending in, or partially affecting a vehicle on public roads). Panama refers to them as non-fatal road traffic crashes. Trinidad and Tobago defines them as road traffic crashes involving injuries to people or animals, or significant damage to property.
15 The fourth edition of the Model Minimum Uniform Crash Criteria defines a suspected serious injury as any non-fatal injury that results in one or more of the following: i) severe laceration resulting in exposure of underlying tissues, muscle, or organs or resulting in significant loss of blood; ii) broken or distorted extremity (arm or leg); iii) crush injuries; iv) suspected skull, chest, or abdominal injury other than bruises or minor lacerations; v) significant burns (second- and third-degree burns over 10% or more of the body); vi) unconsciousness when taken from the crash scene, and vii) paralysis. For further information, see: Federal Highway Administration, National Highway Traffic Safety Administration. The National Definition for Serious Injuries. MMUCC 4th edition. Washington, D.C.: NHTSA; 2012.
16 Antigua and Barbuda, Argentina, Barbados, Bolivia (Plurinational State of), Brazil, the British Virgin Islands, Colombia, Canada, Chile, Costa Rica, the Dominican Republic, Ecuador, Guatemala, Guyana, Mexico, Nicaragua, Panama, Paraguay, Saint Lucia, the United States, and Uruguay.
17 Antigua and Barbuda, Barbados, Belize, Bolivia (Plurinational State of), the British Virgin Islands, Chile, Cuba, Dominica, El Salvador, Guatemala, Guyana, Honduras, Jamaica, Nicaragua, Panama, Paraguay, Peru, and Trinidad and Tobago.
18 The Bahamas, Belize, and Haiti reported no data for the period 2010-2021. Data are not included from countries or territories that did not participate in the report, as they did not provide information on registered motor vehicles (Venezuela [Bolivarian Republic of], Grenada, Saint Vincent and the Grenadines, Saint Kitts and Nevis, and Puerto Rico).
19 Guyana’s data is from 2014. The data for Panama and the United States is from 2020.
20 The following countries did not report the number of registered motorcycles: The Bahamas, Barbados, Belize, Dominica, Haiti, Panama, Saint Lucia, and Uruguay. Guyana provided information for the period 2012-2014 only. Trinidad and Tobago provided data for 2021 only.