The Pan American Health Organization (PAHO) has launched a new interactive dashboard to enhance monitoring and analysis of respiratory virus circulation trends across the Americas, with the goal of strengthening surveillance and facilitating timely analysis of regional trends.
This interactive dashboard presents virological data (from FluNet) and epidemiological data (from FluID) available through the regional data hub (AMart), providing an intuitive, multilingual platform for exploring key indicators.
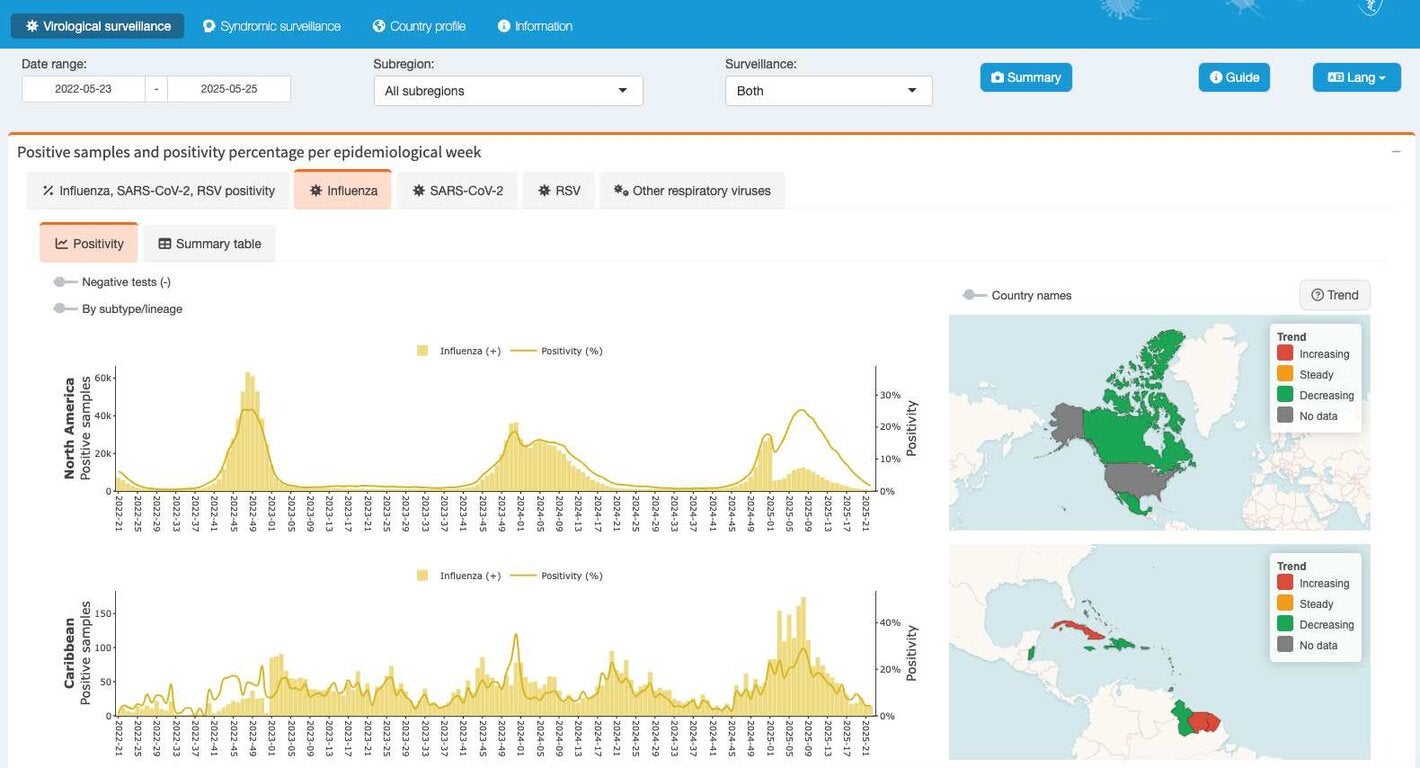
The dashboard features three main sections:
- Virologic Surveillance presents percent positivity and laboratory sample data for all countries and subregions, enabling detailed tracking of virus circulation patterns.
- Syndromic Surveillance: displays data on reported cases of severe acute respiratory infection (SARI) and influenza-like illness (ILI), along with intensive care unit (ICU) admissions and SARI-related deaths, offering insights into the clinical presentation of circulating respiratory viruses.
- Country Profiles: allows users to select any country in the Americas and view all related virologic and syndromic surveillance data on a single, integrated page.
To complement the presentation, the webinar included practical exercises demonstrating how to navigate the dashboard, customize visualizations, and interpret trends for real-world public health scenarios. These hands-on examples illustrated how the tool can support routine surveillance activities, situation analysis, and communication of findings at national and regional levels.
All dashboard visualizations are interactive, customizable by time period, and available in Spanish, English, French, and Portuguese. The tool is updated weekly and is intended for public health professionals, health authorities, and other stakeholders involved in respiratory virus surveillance.