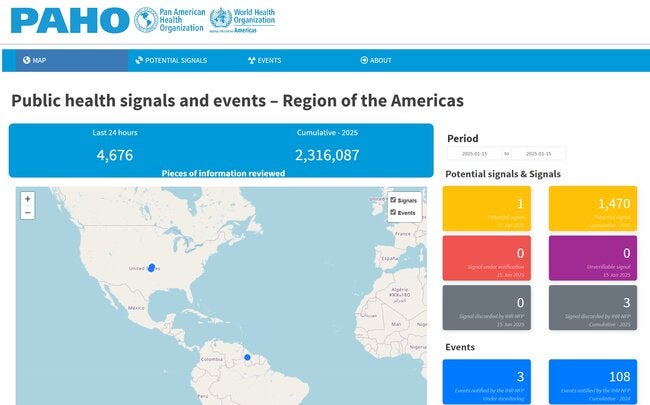
Explore the Region of the Americas public health signals and events being monitored to view data on select events. This dashboard can be filtered by location, status (current or closed), designation (substantiated or not substantiated, and hazard.
Monitoring Dashboards by Topic
This dashboard provides timely and comprehensive data on yellow fever in the Region of the Americas. It aims to support early warning mechanisms and empower decision-makers with real-time, accurate information for outbreak and emergency responses. It includes current surveillance data starting in 2024. To provide historical context, annual figures on human cases and fatalities from 1960 to 2023 are presented at the subnational level (administrative level 1). In some settings, more detailed information is available at the subnational level (administrative level 2), as well as data on reported epizootics in non-human primates.
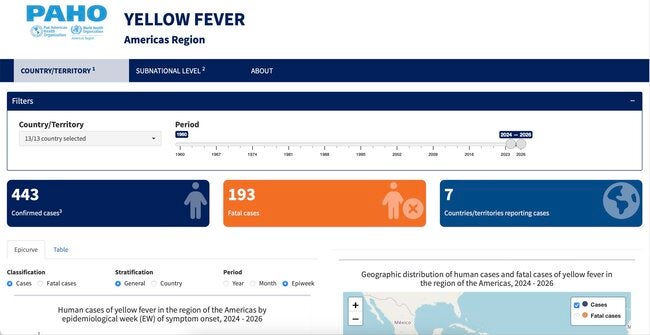
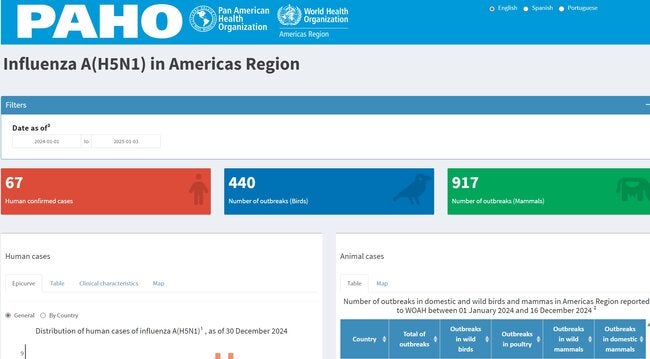
On this dashboard you will find data on human cases by epidemiological week and country in the Americas, as well as data by subnational levels, and clinical characteristics. Additionally, the number of outbreaks in animals by country and type of animal outbreak is provided. The distribution of human cases and locations of outbreaks of wild birds, poultry or domestic birds, domestic mammals, or wild mammals is also available.
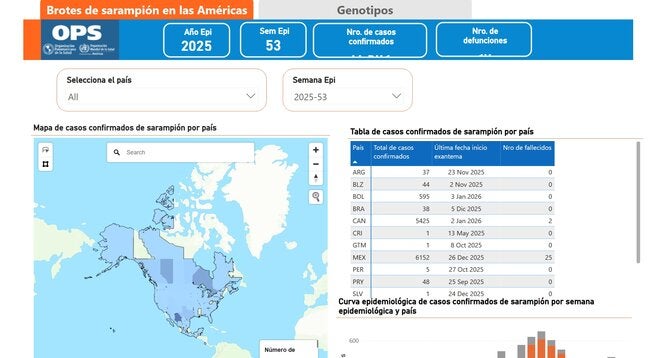
This dashboard provides an integrated overview of the measles situation in the Americas, consolidating up-to-date epidemiological information to support monitoring and decision-making. It interactively presents the number of cases, their geographic distribution, the temporal evolution of outbreaks, and the characteristics of the affected population, incorporating analyses by country, age, sex, confirmation criteria, source of infection, and vaccination history. Together, the dashboard allows users to explore the dynamics of measles from a territorial, temporal, and population perspective, facilitating the identification of risks, gaps, and priorities to guide public health prevention and response actions.
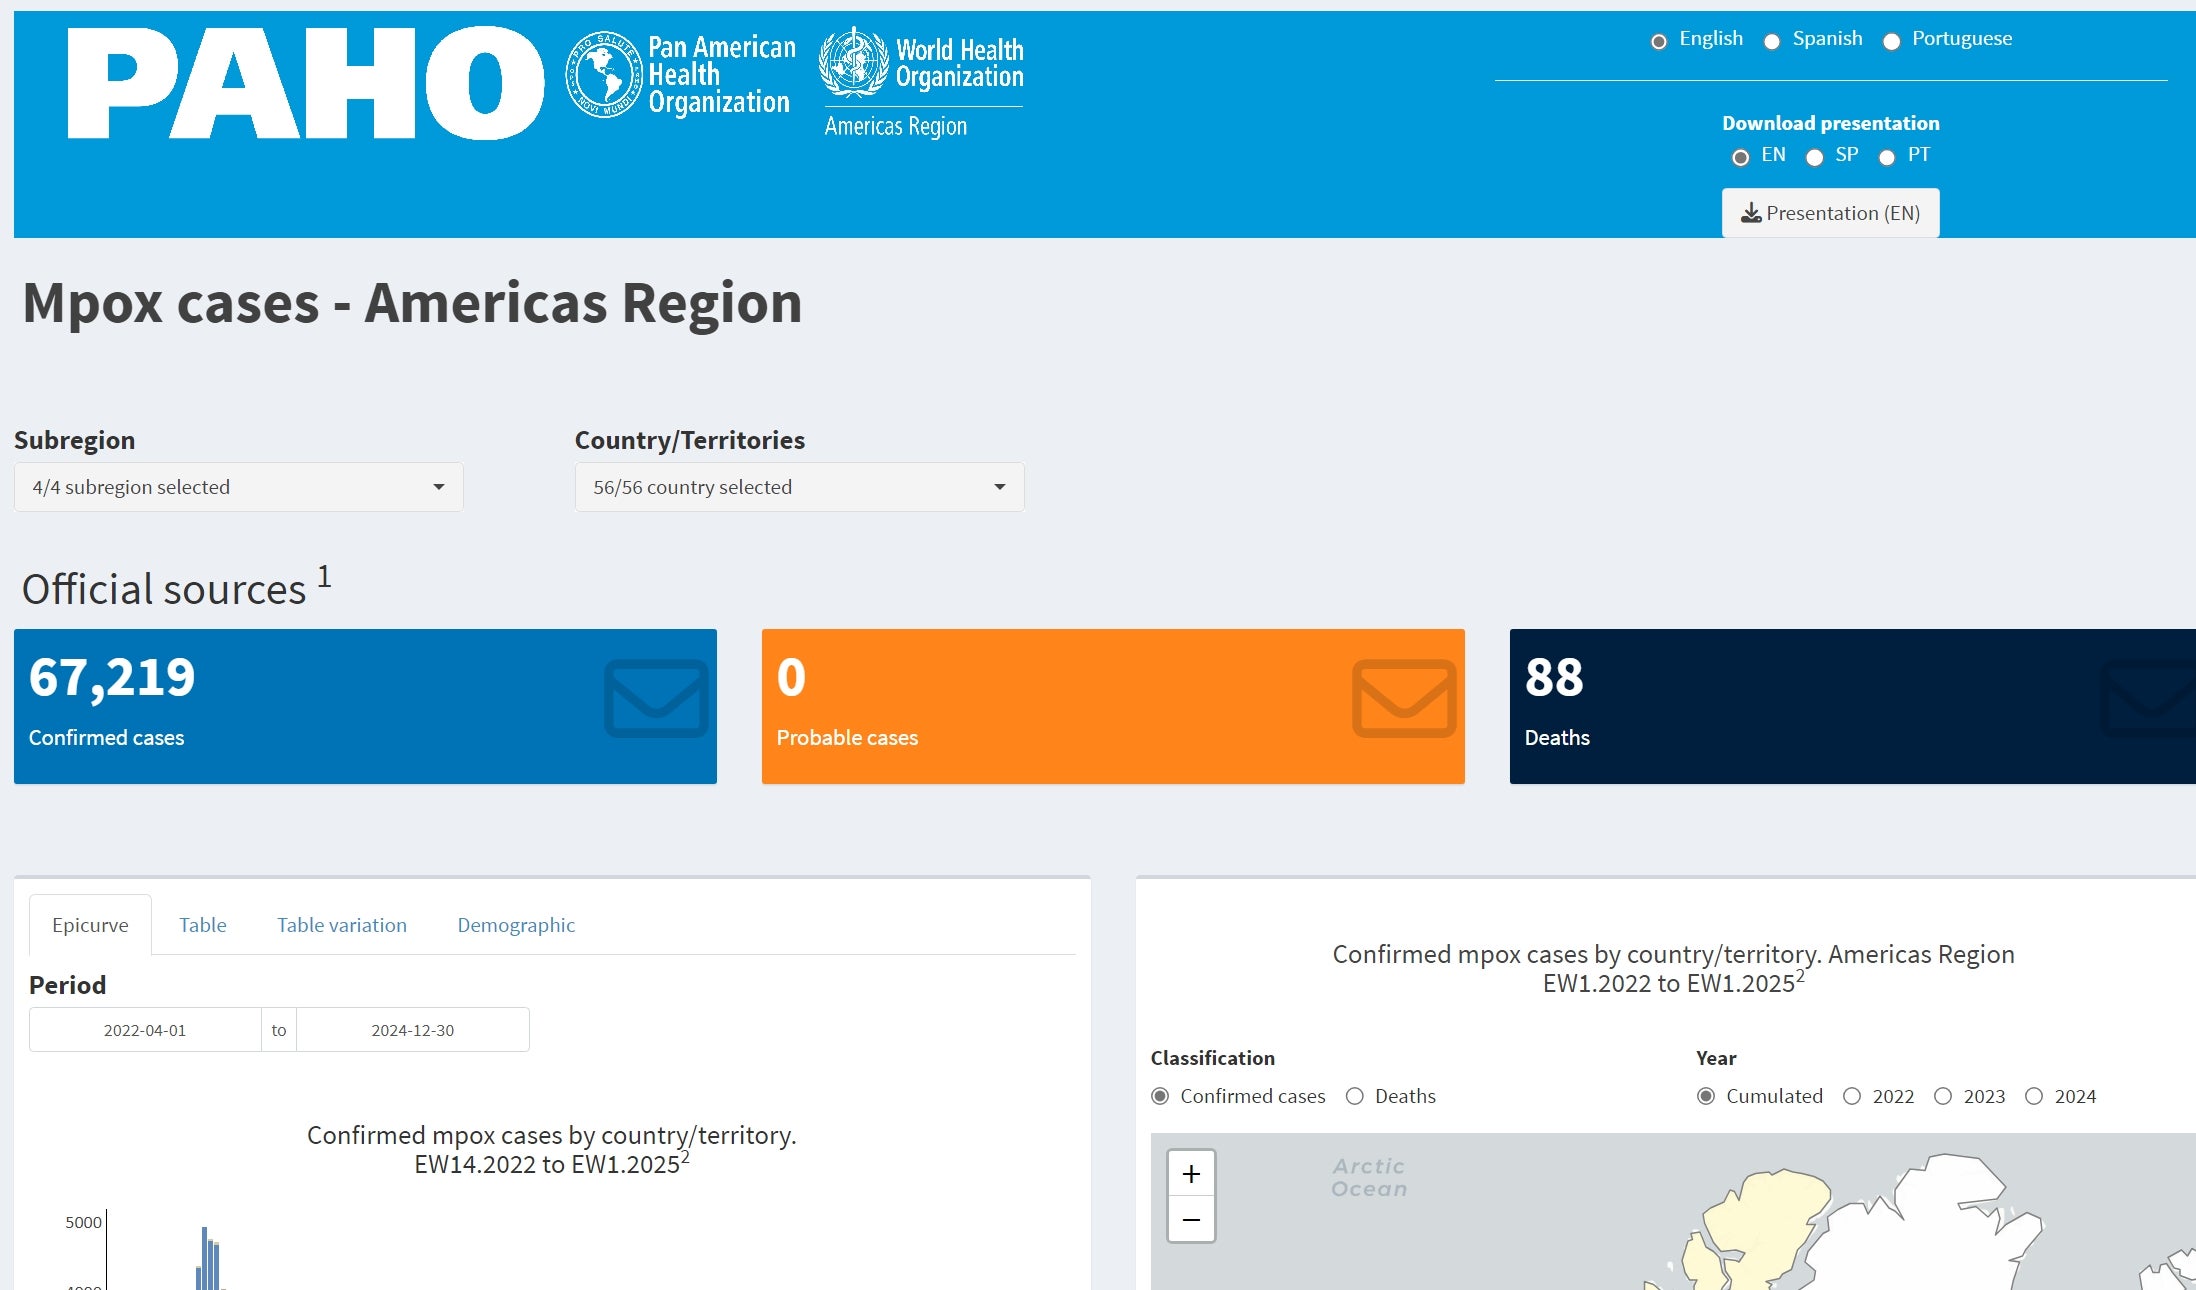
Explore the Region of the Americas mpox dashboard data of confirmed cases, suspected cases, and deaths. The data can be filtered by country/territory and includes epidemiological curve graphs and total cases by location.
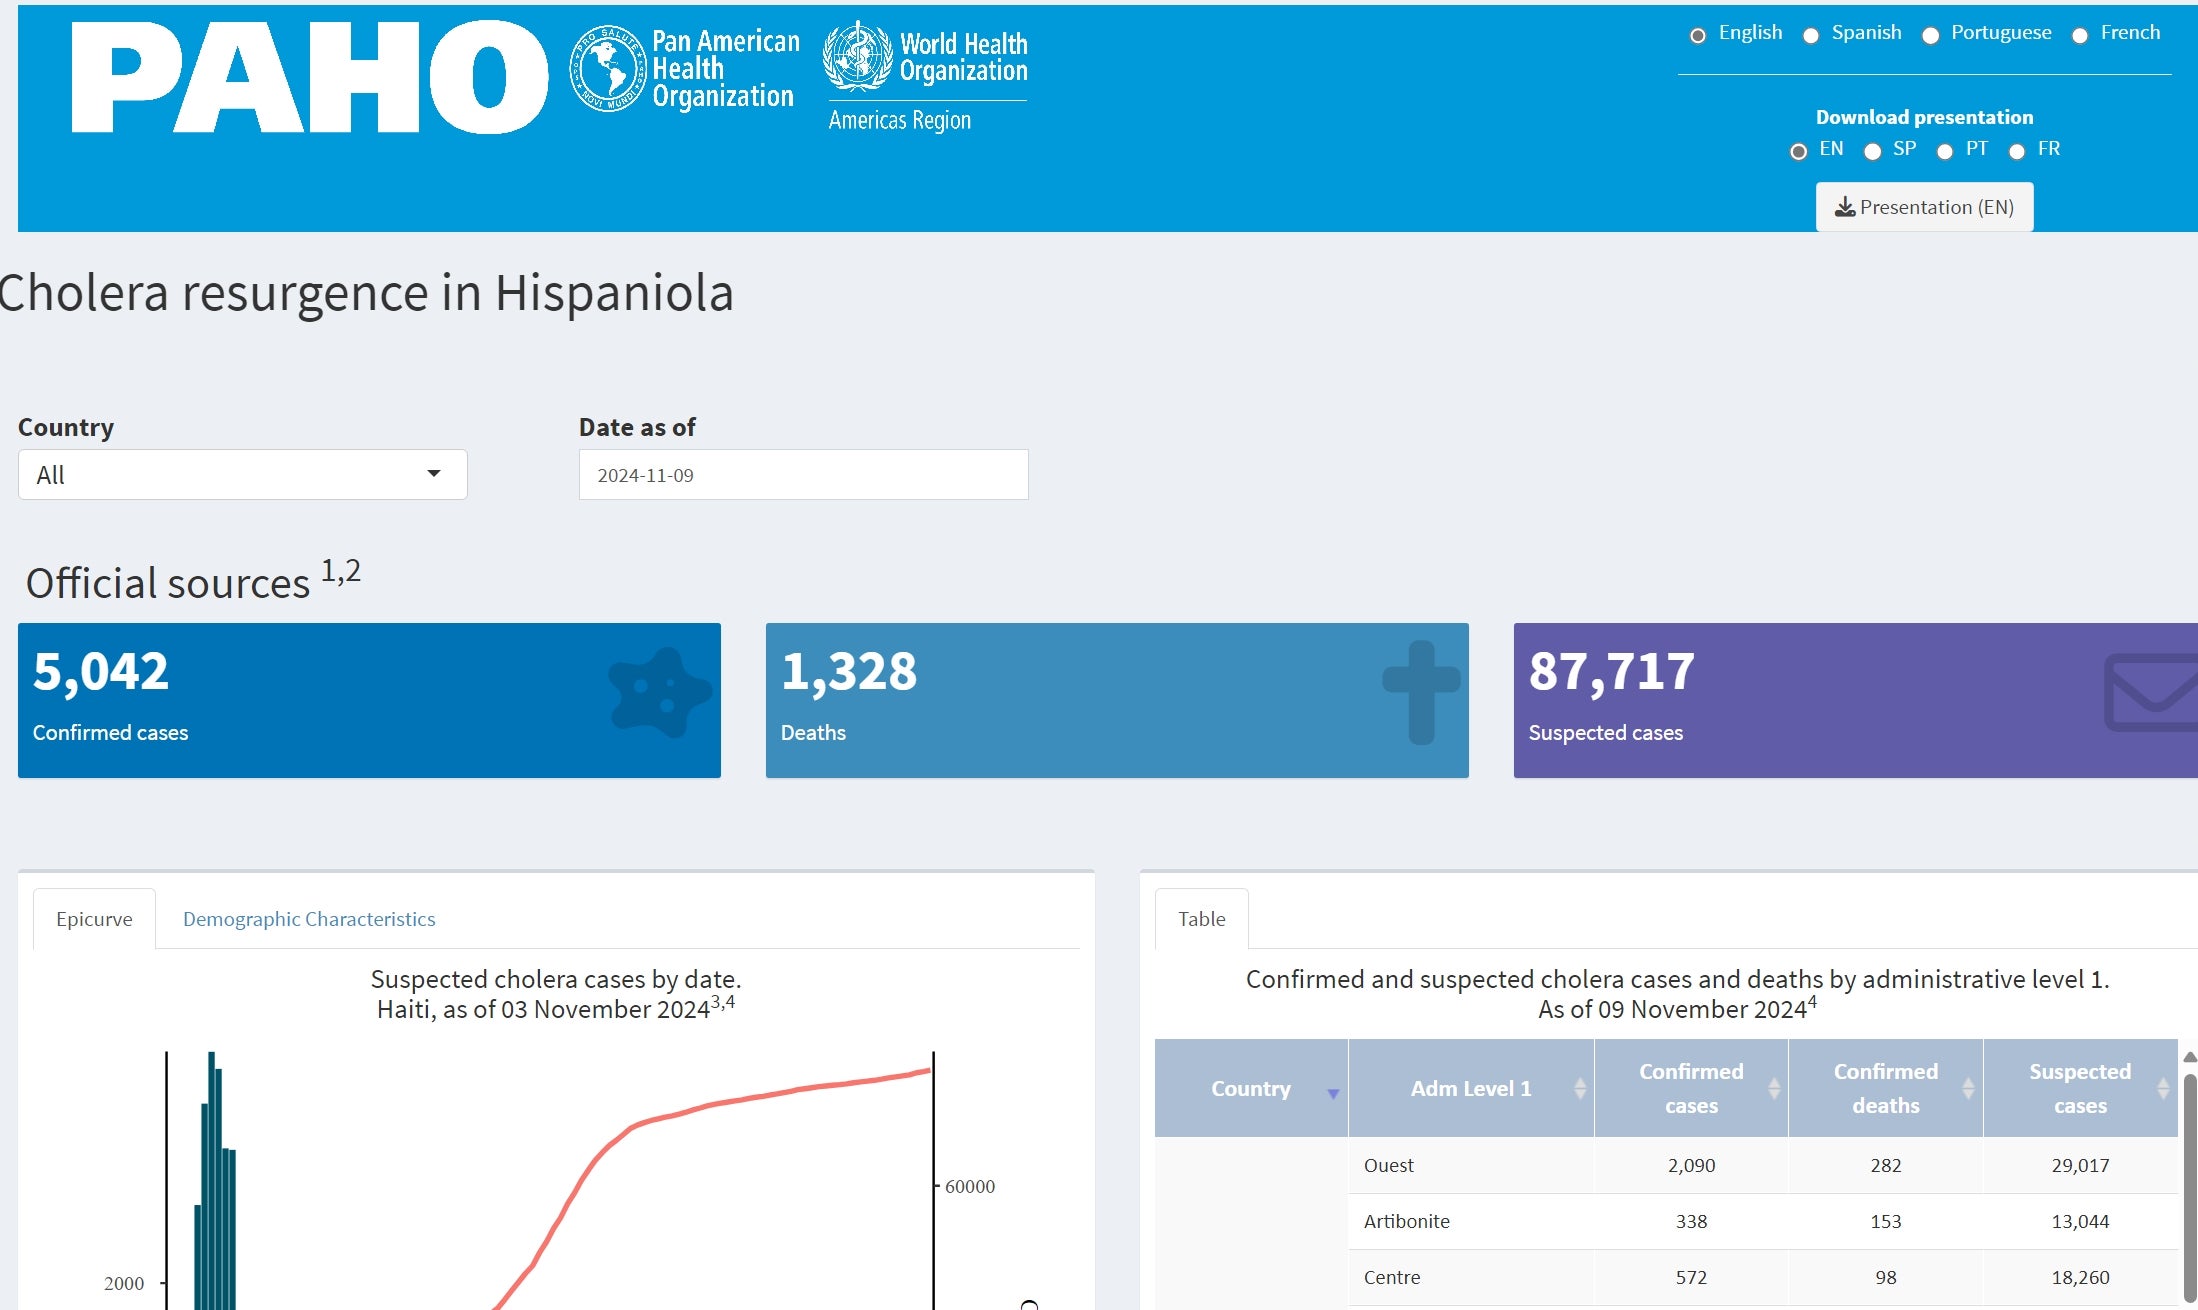
Explore the Cholera Resurgence in Hispaniola dashboard showing the confirmed and suspected cases reported since 2022. Data is shown by Department/Province (Admin level 1). The data can be filtered by country/territory and includes epidemiological curve graphs and total cases by location.
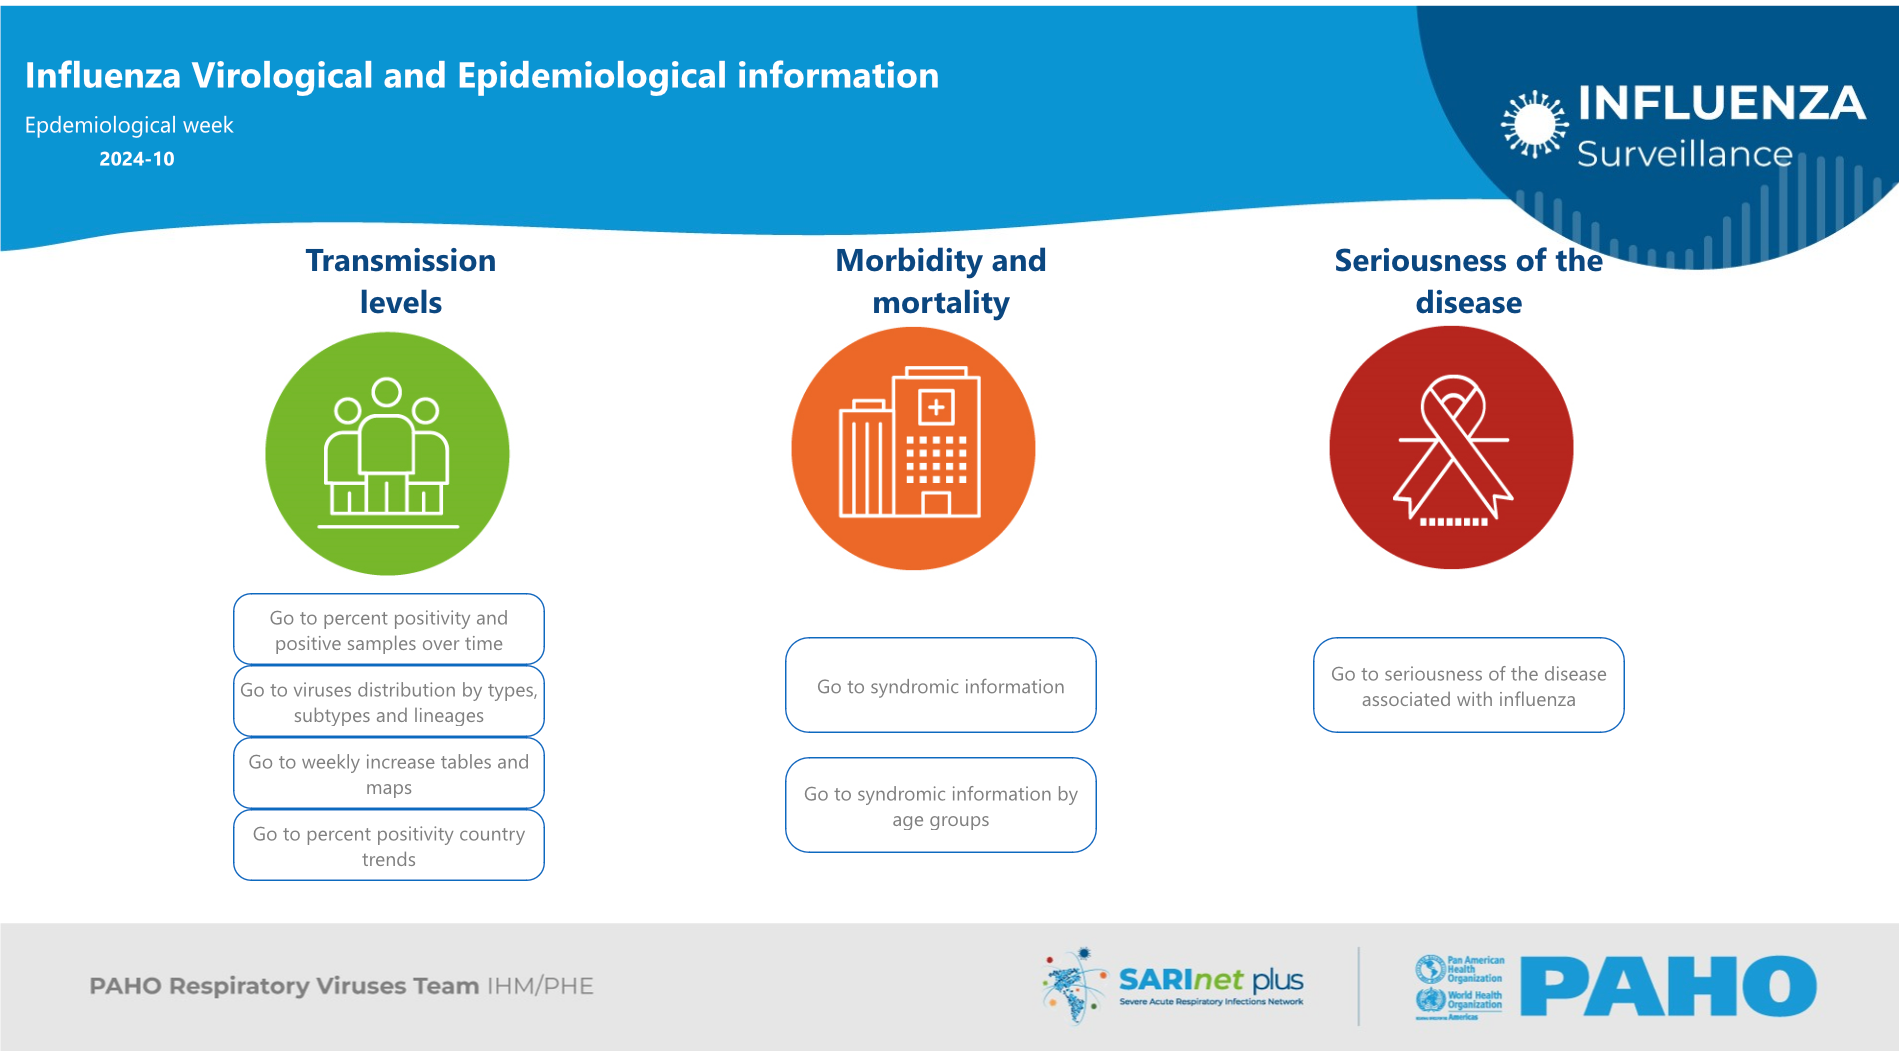
On this dashboard you will find detailed information on transmission levels, morbidity, and mortality associated with influenza, as well as the severity of the disease in reported cases in the Americas region through the FluNet and FluID platforms for sentinel surveillance of respiratory viruses.
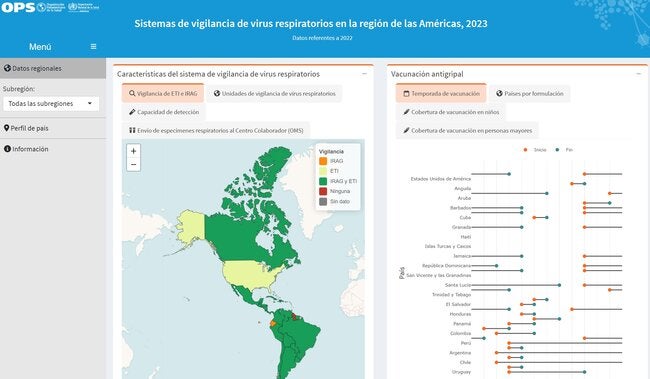
This dashboard provides data and visualizations to enable a comprehensive analysis of respiratory virus surveillance systems in the Americas region. It includes a section with regional data, offering information on the characteristics of the surveillance system, national influenza centers, and flu vaccination. It also features a country profile section, which provides more specific indicators, such as sociodemographic data, surveillance system characteristics, operational research, prevention and control, and pandemic preparedness.
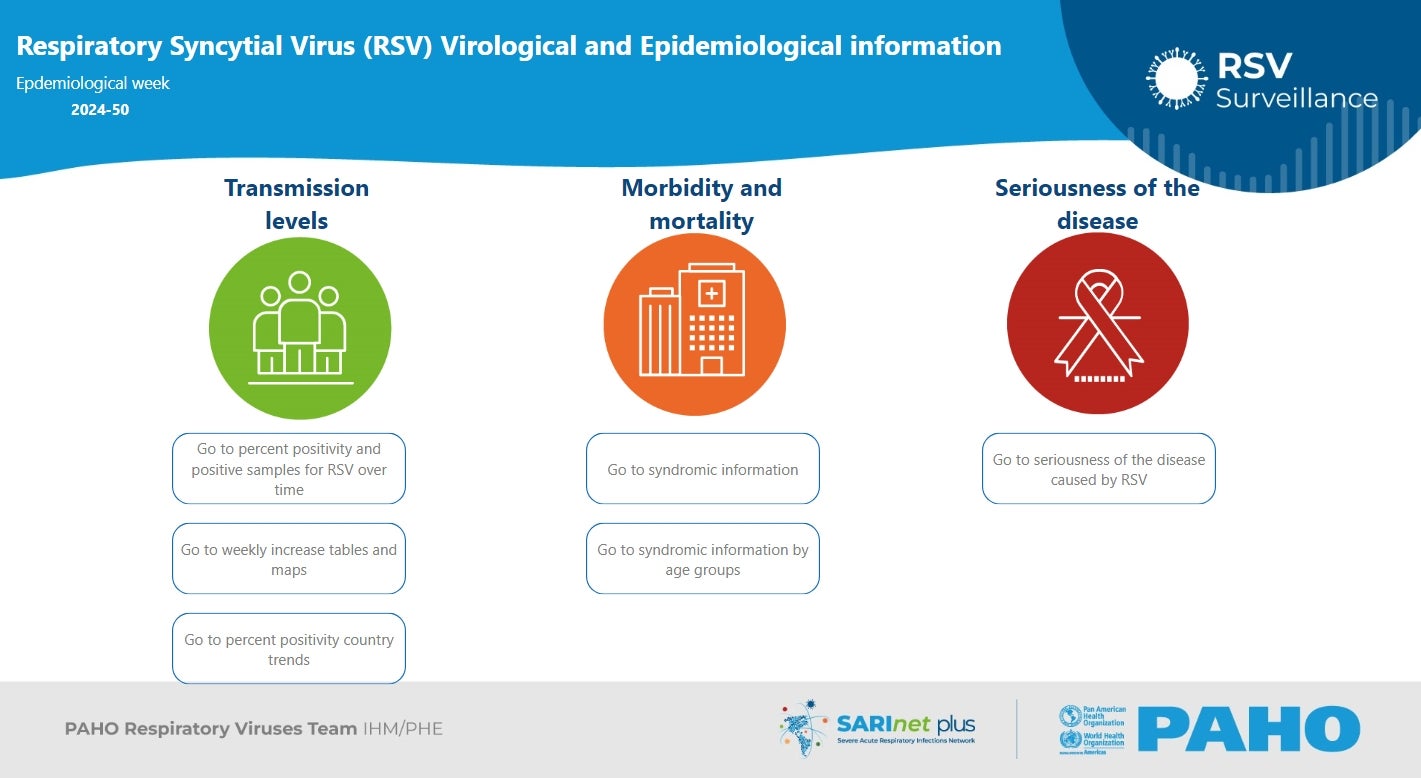
On this dashboard, you will find detailed information on transmission levels, morbidity, and mortality associated with Respiratory Syncytial Virus (RSV), as well as the severity of the disease in reported cases in the Americas region through the FluNet and FluID platforms for sentinel surveillance of respiratory viruses.
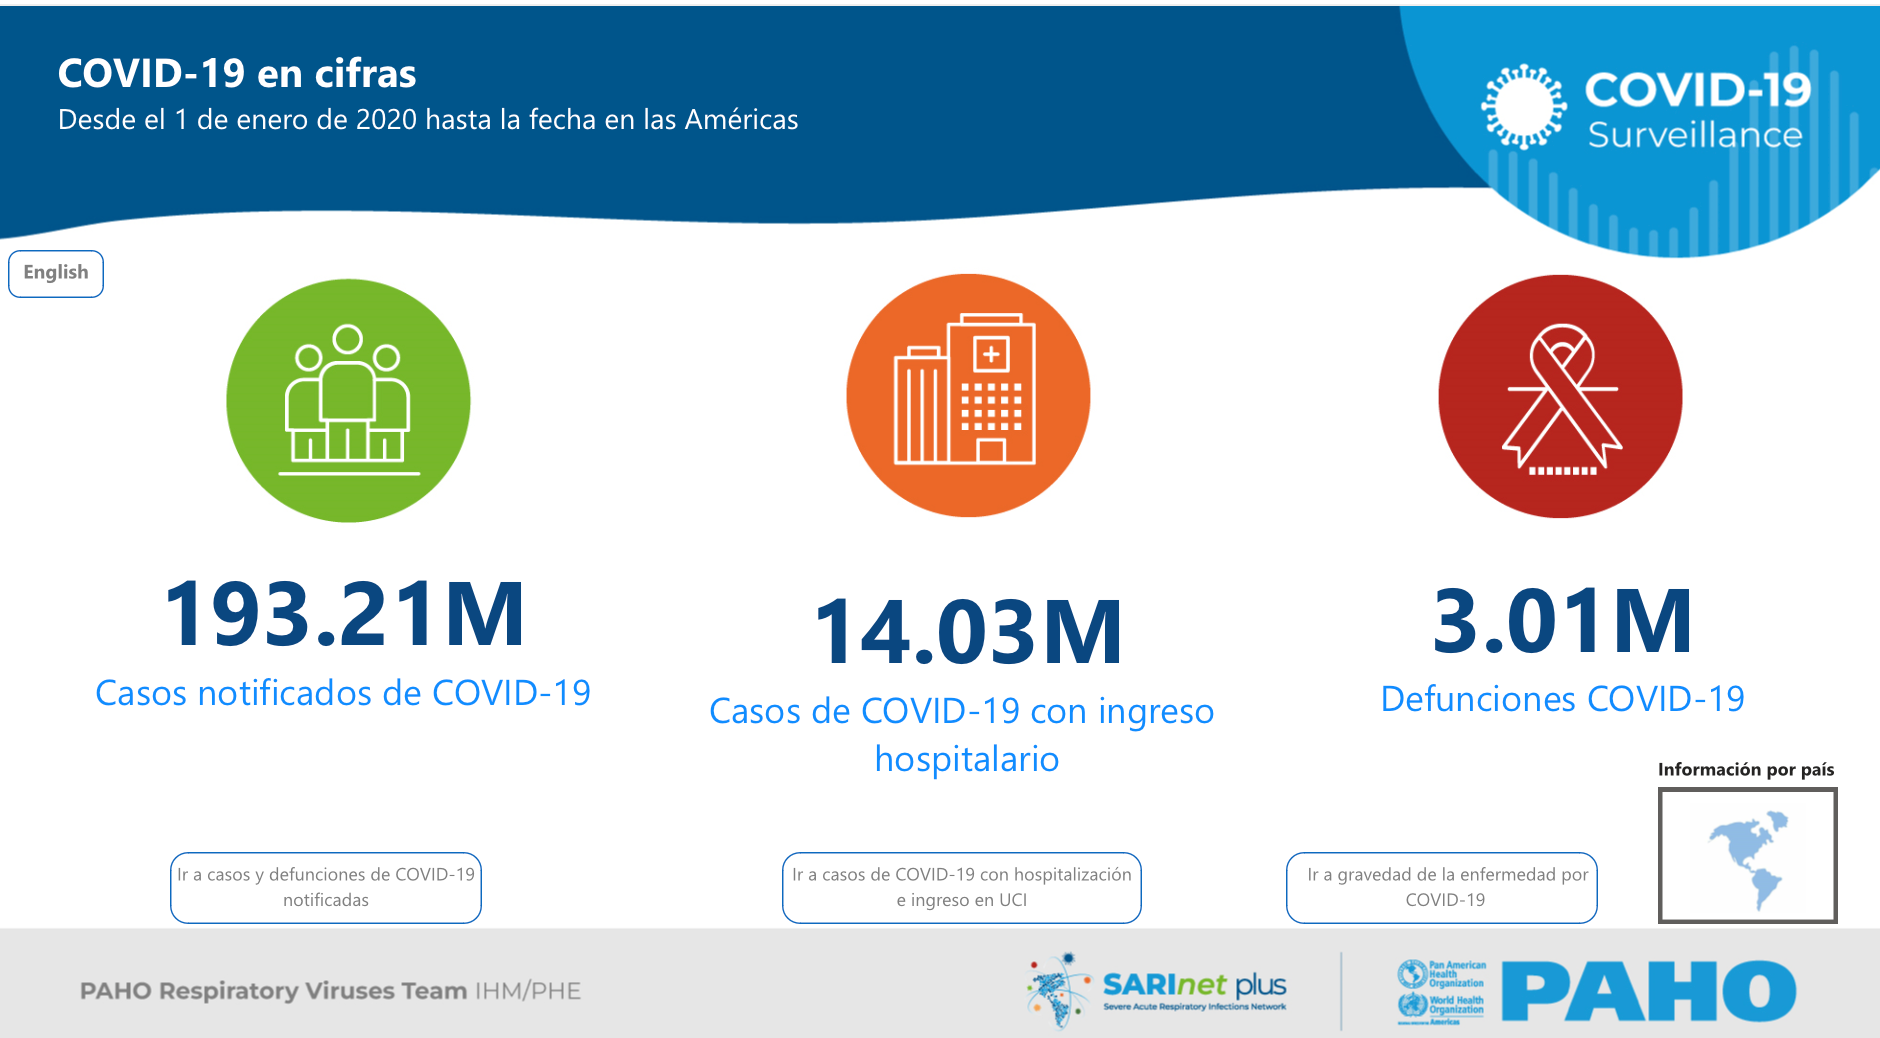
Explore these dashboards to view cumulative numbers of COVID-19 cases, hospitalizations and associated deaths, weekly distribution of new COVID-19 cases, morbidity, mortality, and severity of SARS-CoV-2-associated disease. Also, SARS CoV2 transmission levels and variants tracking in the Region of the Americas.
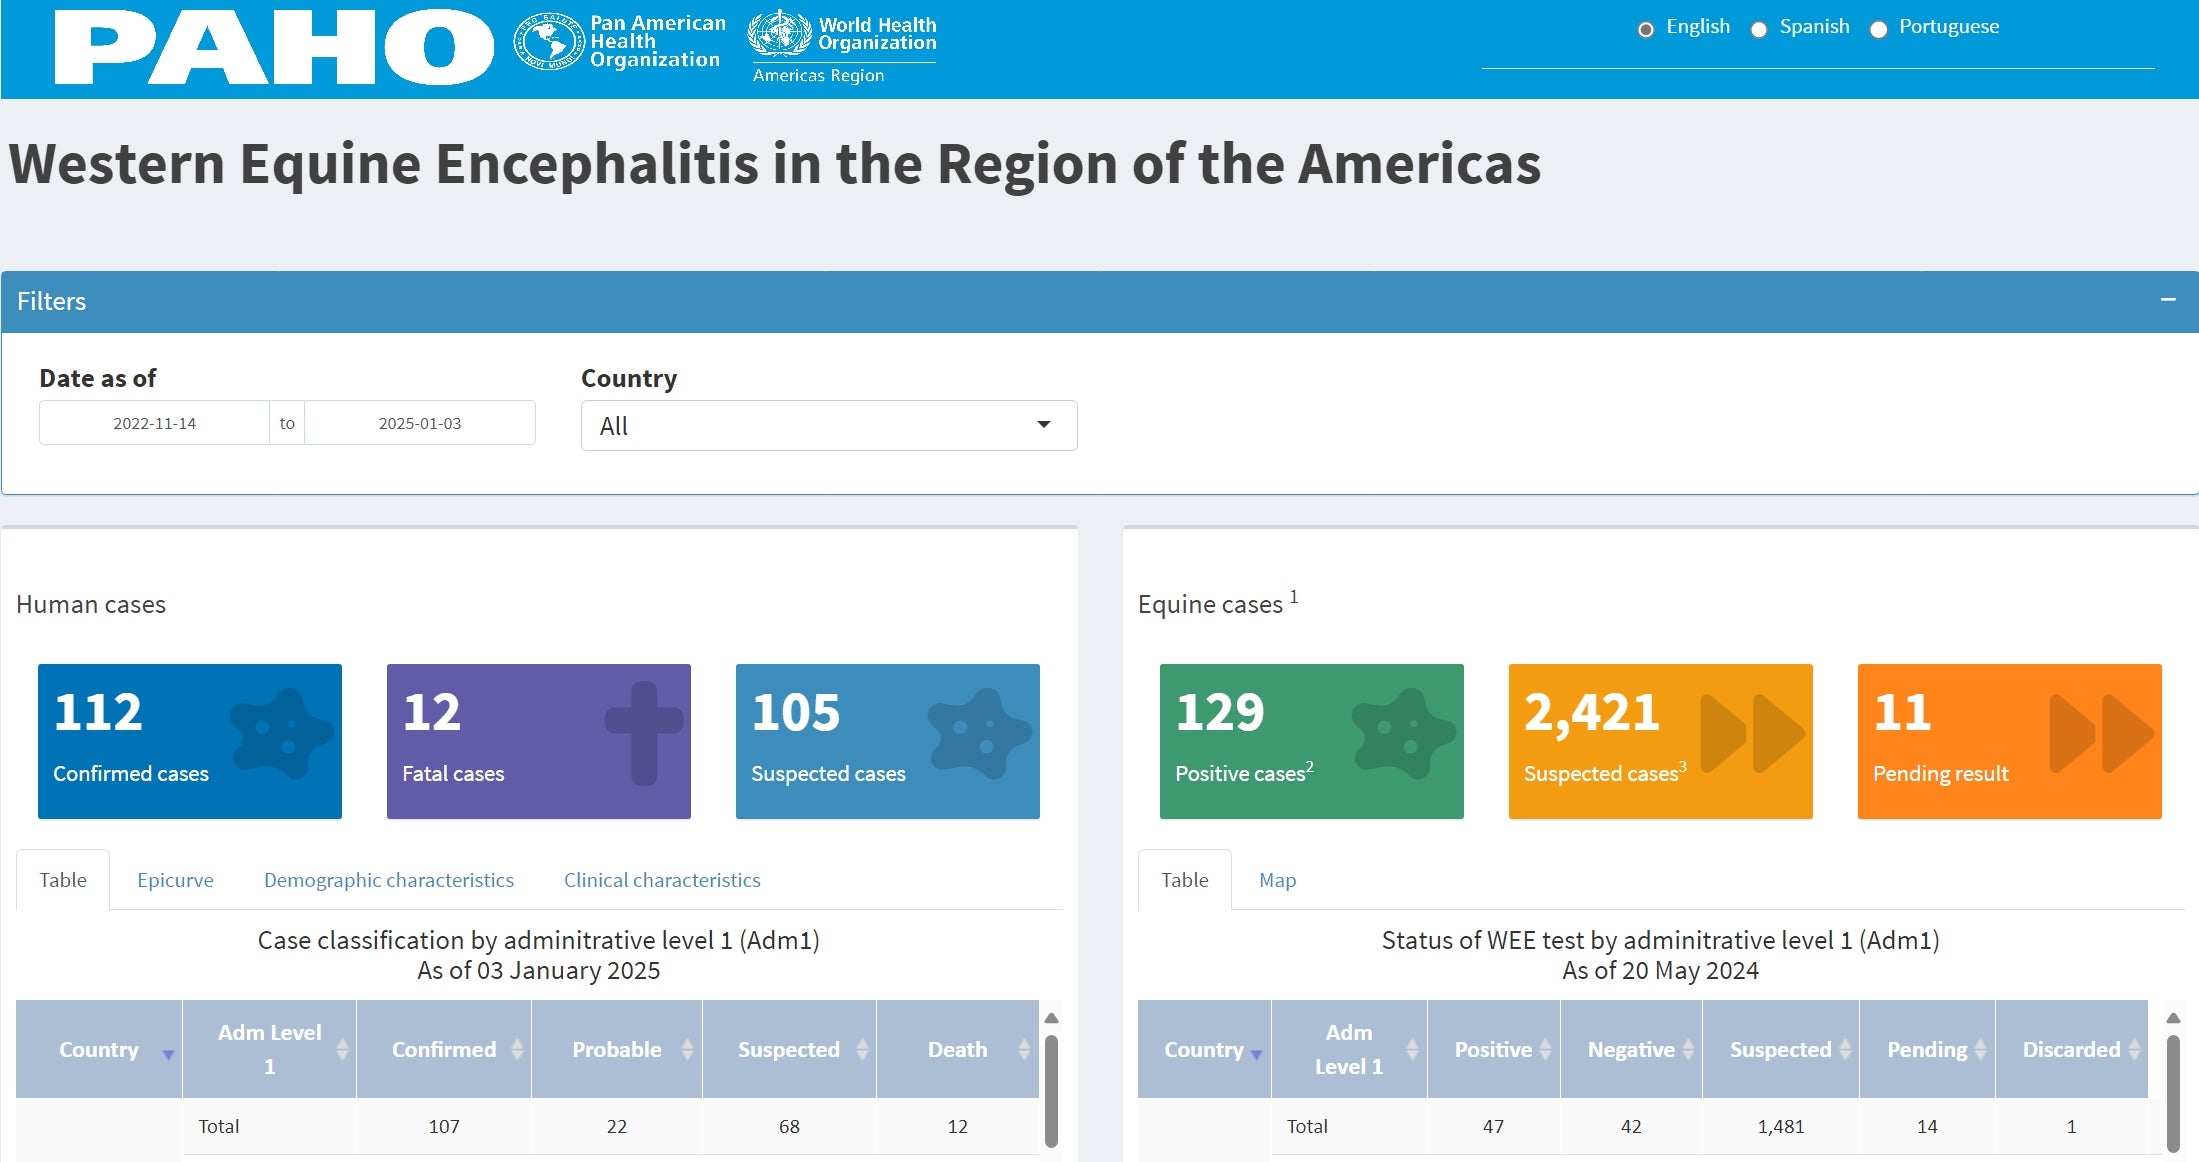
Explore this dashboard to view the Equine Encephalitis epidemiological situation in the Region of the Americas.